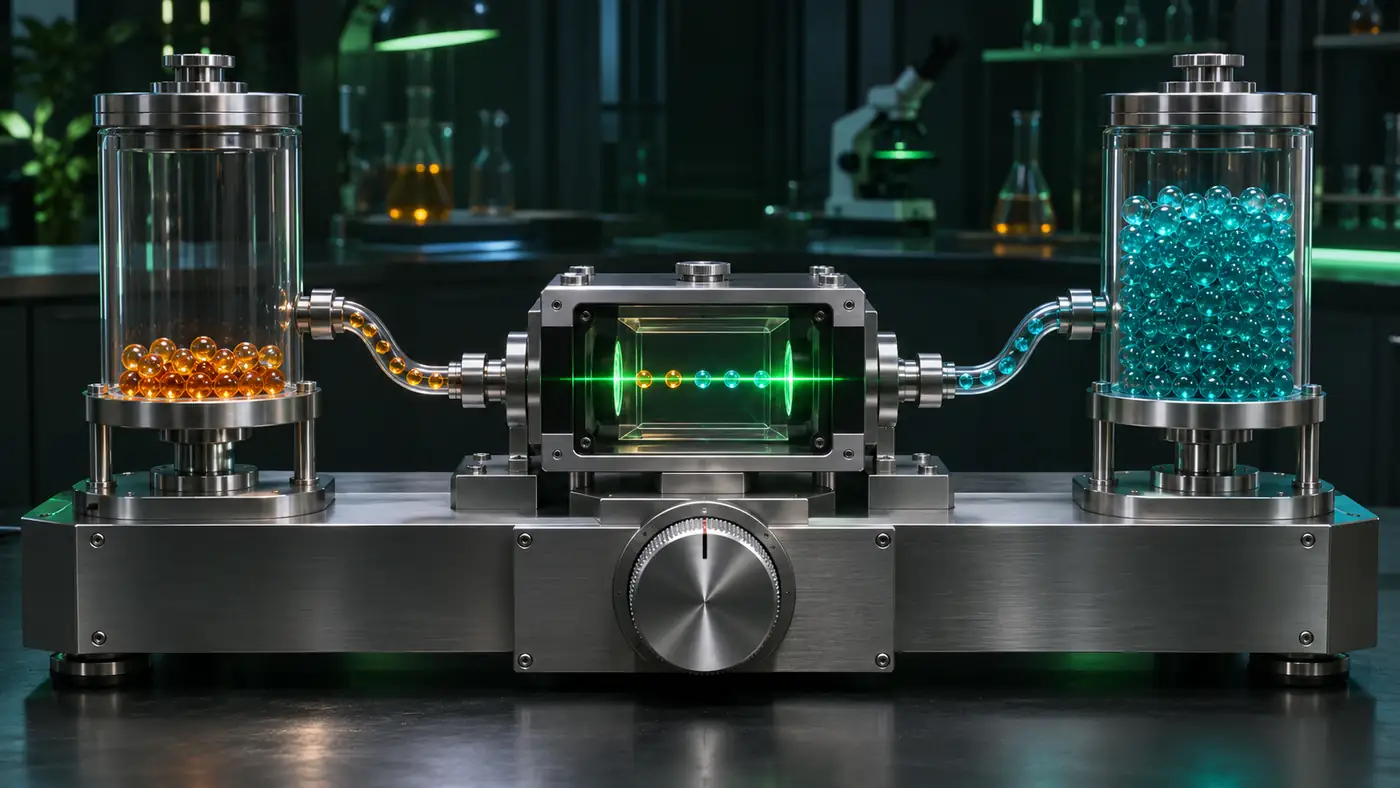
Reproduce the goal: first turn "enough" into a checkable problem
There are many positive film reviews in the Calibration Set, and there are very few negative film reviews. Can one temperature still take care of two types at the same time? Intuition is easy to jump directly to "must class calibration". However, before adding parameters, it is necessary to confirm that the problem comes from the category ratio, rather than a decrease in sample size, an accidental absence of difficult cases, or the evaluation distribution has changed together. The new controlled problem in this article is: When the total amount is fixed, only the category composition of the calibration sample is adjusted. How can the probability loss of the same global temperature change on the fixed audit set?
The previous article compares temperature scaling and order-insured regression. This article does not continue to select methods, and only uses a fixed temperature fitting program. Models, original scores, labels, truncation lengths, and audit samples are all frozen. The new products are sixty sets of calibration identities, temperature search trajectories, overall and classification indicators, and independent recalculation scripts. This makes a question that is easily discussed in general becomes an experiment that can be asked line by line.
The "enough" here can only be answered according to the pre-specified indicators. A reduction in the average loss does not mean that each category is reliable, and it does not mean that the probability of each sample is accurate. We also have no training categorical temperatures, so we cannot claim that global temperatures are better than more sophisticated methods. The minimum experiment measures sensitivity first, and then there is reason to decide whether to increase the degree of freedom of the model.
Core Idea: The Proportion Changes Who Speaks to the Objective Function
temperature scaling divides the original fraction of the model output, that is, logits, and then divides it by a positive number, and then converts it to probability. For the two classifications, the difference between the two scores is , have
here is a sample, is a score vector of two shapes, is the positive category probability, is the global temperature. Negative probability is equal to . The positive temperature does not change the score-size relationship, so the classification result should remain the same; it only changes the sharpness of the probability. This is an invariant that can be directly audited in this experiment.
Fit is used to use negative log-likelihood, referred to as NLL: a small probability of giving a real category a small probability will be punished with a greater penalty. Let the front ratio of the Calibration Set be , the average loss grouped by real labels is and , then
This decomposition shows that increasing the proportion of the front will increase the weight of the front group in the objective function. However, this time the real sample subset is used, and the proportional change will also change the specific members, so the loss of experience in the group is not completely fixed. All changes cannot be interpreted as pure causal effects of abstract weights. The paired in-class sort can reduce unrelated disturbances, but cannot eliminate finite sample differences.
In terms of paper reports, the 2017 study by Guo, Pleiss, Sun and Weinberger showed that temperature scaling is effective on multiple datasets of its research. This article does not reproduce the complete benchmarks, nor does it expand the general guarantee under the category imbalance. The numbers below come only from this round of fixed checkpoints and actual execution subset experiments.
Data Boundary and Evaluation Protocol
Follow the SST-2 English emotional classification checkpoint of DistilBERT, the model revision is 714eb0fa89d2f80546fda750413ed43d93601a13; the data revision is 8d51e7e4887a4caaa95b3fbebbf53c0490b58bbb. The calibration pool 256 articles and the agreement audit pool 360, the identity comes from the division of hashes that were frozen at the beginning of this round. The official original label is used directly, and there are no new semantic labels or artificial gold labels.
It must be disclosed: SST-2 has been used in historical research, and the audit pool has also reported the results in the previous articles. Therefore, this is a developmental method experiment of reusing data, which cannot be called no test, let alone final confirmation. IMDb Sanchi has no access at all. Whether the pre-trained text of the model contains these public sentences has not been polluted.
Preservation agreement before formal analysis: Each time exactly one hundred calibration samples are taken, the positive numbers are ten, fifty, and ninety, and the negative number is supplemented by the total amount. Twenty predefined seeds are used, and each seed is sorted by sample identity hashing within two categories, and then prefixed. The three proportions share the same order within the same type; do not put back sampling, do not copy a few classes, and do not filter the samples according to the model error. A total of 60 fits, all reported.
The main indicator is the stable NLL of the fixed audit pool, and the secondary indicator is the Brier score of the two types of summation, the NLL grouped by real label and the correct number. No temperature, seed, or ratio is selected with audit indicators. Twenty repetitions from the same limited pool, the following standard deviation is sampling sensitivity, not the overall Confidence interval, nor is it the error bar obtained by 20 independent data collections.
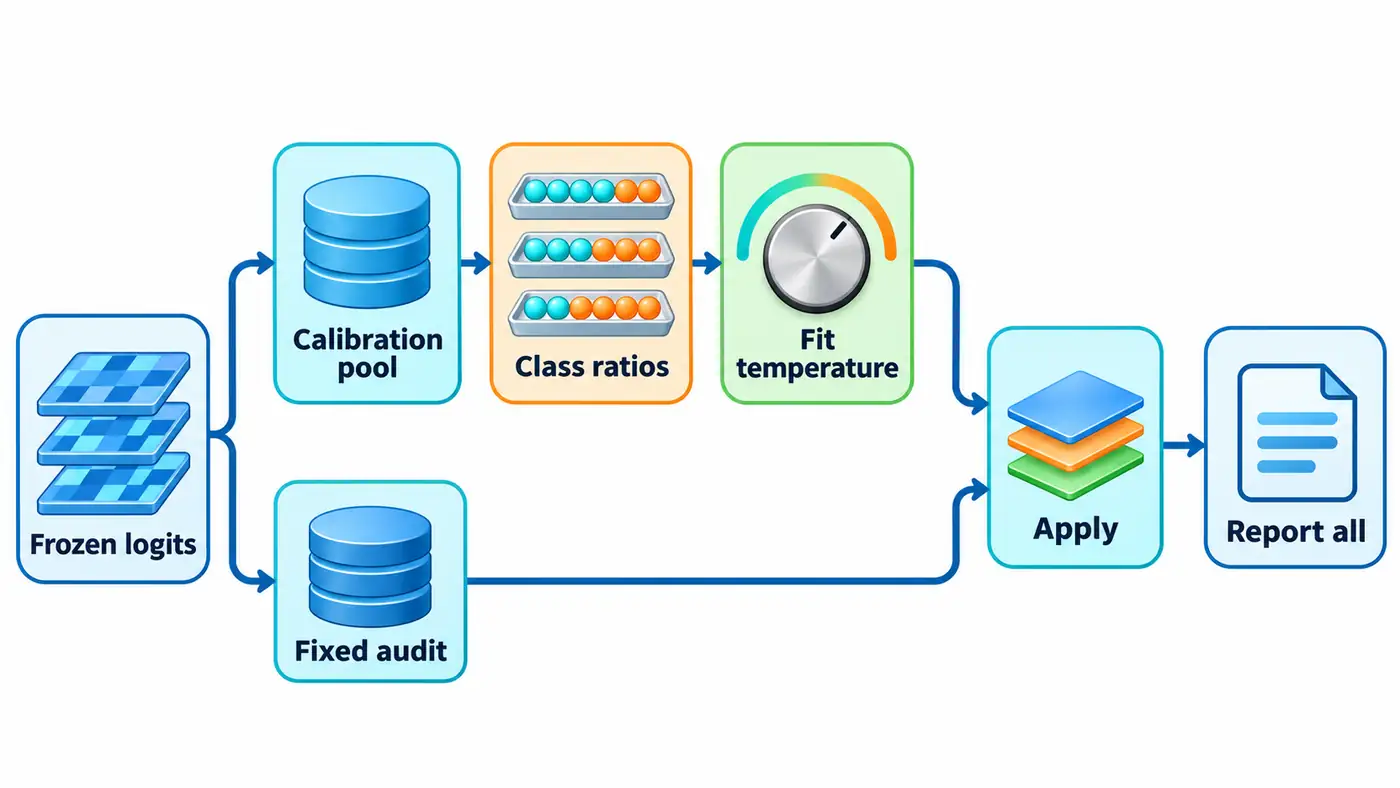
The method diagram only expresses the data flow, and the color ratio of the tray is a conceptual diagram, not an experimental result map. The audit branch directly enters the application and report, and cannot be reflowed to the fitting.
Guide to the official implementation and Minimum Implementation
When reading the author's official repository, first read temperature_scale Divide logits, see again set_temperature How to collect calibration scores, optimize the temperature with cross entropy, and finally look at the error box code. This fixed official submission ce1154ec7d5235eee046f28875c3dd8421f11d45, the specific permalink and license are written to the source map.
There is no local replicator optimizer. In order to ensure that the temperature is positive and the search process is easy to check, inherit the independent teaching implementation of the previous chapter and optimize the inverse temperature. , limit it to inside. Do a hundred two-point searches on the target derivative, and save the boundary sign, derivative and midpoint of each step interval. This implementation difference must be made public: it validates the same scalar transformation, which is not equal to running the paper training script line by line.
Stable calculations are also critical. Remember be a true label, and make , then the single-sample loss is
This will not first round the probability to zero and then take the logarithm. Brier uses , take the sample average; coefficient two corresponds to the two types of sum caliber. It is double the caliber of only calculating the square error of the positive probability. The exponential, log and label mappings in the formula are independently checked by another script.
What we tested: the imbalance does not produce monotonous deterioration
| Calibrate the number of fronts/total | Temperature Mean ± Standard Deviation | Audit NLL Mean ± standard deviation | Audit Brier Mean |
|---|---|---|---|
| 10/100 | 2.4957±0.2090 | 0.238421±0.002086 | 0.135443 |
| 50/100 | 2.4683±0.3352 | 0.240355±0.004107 | 0.136042 |
| 90/100 | 2.3981±0.2012 | 0.238230±0.001559 | 0.135769 |
The original audit NLL is 0.384113, and the Brier is 0.1544013. 60 positive temperature transformations all retain 330 correct predictions. In this group of experiments, the average loss of the three compositions was lower than that of the uncalibrated baseline; the equilibrium conditions did not give the lowest average loss, nor the minimum temperature fluctuation.
This is not evidence of "unbalanced benefit". The wrong samples drawn with different conditions and their score strengths are different. The samples in the finite pool are also very small in the 20 repeated height sharing. The author infers that: in this batch of data, the category ratio itself is not enough to explain the temperature failure; the composition of high-confidence errors may be equally important. This explanation has not been intervened separately and can only be used as a follow-up hypothesis.
We checked the computation at two levels. The new analysis reused 616 existing model predictions. Separately, we ran eight examples on CPU using the same model and cached data to check that inference still worked. The trial used single precision, four threads, and a maximum of 512 tokens. The forward pass took about 0.06 seconds, and the whole process after imports took about 0.53 seconds. We verified the cached downloads against the originally recorded hashes and reused them without downloading the weights again.
Instead of invoking the fitter, the independent script uses the golden split search to re-find the target minimum, and repeats the identity, probability loss, Brier and correct number from the original fraction. All 60 groups were passed, and the maximum difference between the indicators was about 3.3 by 10 to the negative 16th power. This is automatic deterministic recalculation, not manual semantic review; running commands, exit codes, input hashing and output are kept in the delivery record.
Failure investigation: first exclude agreement changes
If the Accuracy changes occur in the reproduction, you should first check the label mapping, the score sequence, whether the non-positive temperature is used, and the judgment rules for equal fractions. A single positive temperature should not change the classification boundary. If the total amount of the category ratio is also changed, the control conditions of this article will be lost; if a few classes are supplemented through repeated sampling, the number of valid independent samples should be recorded separately, and this experiment cannot be pretended to be this experiment.
If the temperature is pasted to the search boundary, the boundary needs to be reported instead of quietly enlarging the interval. When a small number of samples happens to have no errors, the optimization goals may encourage extreme self-confidence; the previous experiment has already shown this path of failure. All the trajectories are reserved this time, and the reader can check whether the edge is touching by himself, without relying on the mean given by the text.
The most hidden error is to use the real tag to pick "category temperature" and use it directly for testing. AT Inference Time does not know the real category, the rule must indicate whether the dependent prediction category is transformed separately for each logit; both are different from the current scalar temperature, and may also change the decision boundary. This article does not implement these methods, and cannot intuitively claim that they can repair this phenomenon.
Code and instructions for reproducing the results
The source code of this article has been disclosed and verified and pinned commit: Source directory、README and run instructions、SOURCE_MAP source map. Full delivery includes entry scripts, independent audits, freeze predictions, protocols, dependencies, resource identities and source maps. The minimum analysis command is as follows:
python run.py
python audit.py
The expected products are the successive records, summary indicators, resource time consumption and independent audit results of 60 groups. The analysis itself only needs the standard library; the real model replay requires the installation of fixed dependencies according to README, and executes resource preparation and eight trial commands. The original SST-2 sentence is not distributed with the source code, because the data card license mark is not clear; the reader is obtained by downloading the script through a fixed version, and the model weight and cache are not entered into the compressed package.
The denominator of each real label group should also be retained when recalculating. The overall indicator is the result of the weighting of each group according to the number of samples; one group has improved more, which may cover the change of the other group. The source code holds the loss of the two label groups one after another, allowing the reader to check this offset, but this article does not append the overall significance of these grouping results. The original labeling group also cannot replace the manual judgment of satire, negation or complex semantics.
Another easily overlooked limitation is the calibration pool coverage. 90% of positive sentences are artificially selected, which only changes the composition of the current public short sentence pool, and does not create a new language style or longer context. Therefore, this intervention cannot represent changes in natural distribution, let alone predict the migration performance of long-term film reviews. Keeping the audit distribution constant is to isolate the problem, and also limit the scope of application of the answer.
Research questions and summary
The next step is to check the parameter migration, but you cannot directly use the temperature of the lowest loss in this audit as a winner. New comparisons must first define pairing rules, estimation objects, and data permissions. If you want to check in the future, "the composition of difficult cases is more important than the scale of the label", you should first register the definition of the error intensity, and clarify which development data to use;
With the calibration budget fixed at 100 examples, three class proportions tested, and the same audit distribution throughout, the global temperature did not perform progressively worse as imbalance increased. It could still help overall probability loss. These results leave open both subgroup reliability and the need for more complex calibration. The reproducible protocol and the absence of a steady decline are worth reporting in their own right.
References
Search date: 2026-11-05. The paper advocates, the implementation details and this measurement are separately stated.
- Chuan Guo、Geoff Pleiss、Yu Sun、Kilian Q. Weinberger,2017, On Calibration of Modern Neural Networks,ICML/PMLR 70.
- Author's official temperature scaling implementation, pinned commit.
- DistilBERT SST-2 Official Model Card.
- Stanford NLP SST-2 data card.
Apps by the author
Here is the author's own product promotion. I also independently developed two daily gadgets: Daily Expense Journal Used to record revenue and expenditure, arrange budget and saving goals, View on the App Store; One Small Action Help you choose small actions according to time and energy, and record your feelings after completion, View on the App Store. More technical articles and personal works are welcome to visit Personal website. These products are independent of this experiment and do not represent the authors or research institutions endorsed by the paper.