The confidence lab: from model confidence to testing when to abstain

Reproducing value: split the average into samples that can be traced
In the previous fixed prediction category, only the temperature of the probability was changed, indicating that the Accuracy is the same and may correspond to different probability mass. This further questioning: Are the samples with the most confident but wrong answers in the original model gathered in some redefinable groups? We fixed the same batch of real predictions, not trained, not calibrated, and only changed the way they were grouped. The goal is not to find a few surprising sentences, but to deliver a wrong audit table that retains denominator, identity and selection rules.
"The most confident" has two meanings: it can refer to the order that exceeds the fixed threshold, or it can refer to the wrong internal ordering. This article is dealt with separately: the main statistics use Confidence for collections with no less than 0.9; the case entry is kept in the descending order of the wrong Confidence in descending order, and the same points are ascending in ascending order according to the original number. The rules are registered before this group calculation, but the overall accuracy has been observed before, so this is still exploring and analysis, and it is impossible to pretend to be a completely blind pre-registration study.
Core Idea: The number of errors and the error rate answer different questions
The Confidence here is one of the larger two-category probability. It is not the natural language evaluation of the model's own ability, nor is it open to generate the true probability of the answer. The calibration paper of Guo et al. discusses the relationship between probability and empirical correctness; this article borrows this measurement perspective, and the newly added length group audit is an independent teaching experiment, not a re-engraving of the original experiment of the paper. Original essay
Assuming that a group contains a large number of samples, even if its error rate is very low, it may contribute the most errors. Conversely, only a small number of samples can have a high proportion, but it is not enough to explain the law of stability. Looking at the denominator first, then looking at the ratio, is the first step from the case story to the testable problem. At the same time, we save all samples, all errors, high confidence samples, and high confidence errors; the main text highlights the main caliber, and the source code retains the complete twelve lines.
Formulas and grouping: write the rules first, then look at the results
where, is the -th example’s score for class . Each batch of logits has shape (batch size, 2). is the normalized probability, is Confidence, is the maximum probability category, is the original label of the data, for error indication. This directly reuse the saved double probability, and use the original logits to independently recalculate.
represent a predetermined group, is the number of high-confidence samples in this group, is the number of errors, is the condition error rate of the main reported condition. When the denominator is zero, the output is null, and the risk cannot be output. It describes the current batch of samples and does not automatically have an overall confidence guarantee.
The length is the original token number obtained by the fixed tokenizer, which contains special marks, and the boundary is no more than 16, 17 to 32, and more than 32. It is not the number of characters, nor the language complexity of manual judgment. Another axis uses data labels: zero is negative, one is positive. First report three length groups and two label groups, and then report six cross groups formed by two axes, together with a total of twelve lines. We did not pick the cut with the largest difference after scanning the boundary.
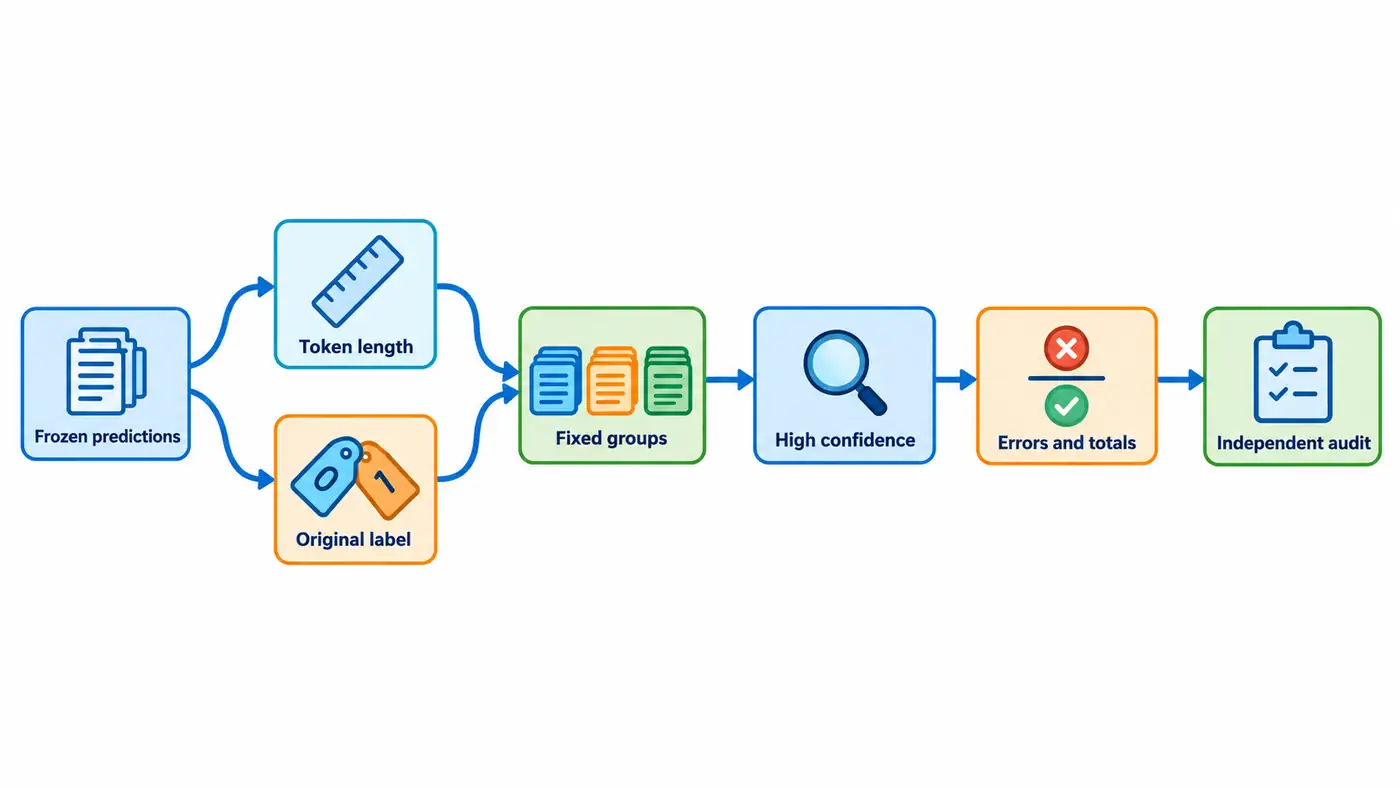
The length in the figure is imported into a fixed group with the original label, and then high confidence screening and error counting are performed. It is a schematic diagram of the method and does not carry quantitative results; the denominator includes the correct and incorrect samples after screening, and cannot only keep the red error mark.
A guide to the official implementation
First confirm from the official model card that this is the English SST-2 emotional classification checkpoint, and then go to the classifier implementation of the fixed Transformers submission. Reading sequence is model output, first position hidden state, pre-sorted linear layer, activation, dropout, and final categorical header. The evaluation mode is closed during training random dropout; this article does not classify the token probability of the generative language model into Confidence . Model card
The source map identifies the pinned Transformers commit, files, line numbers, and Apache license. The official library ran inference. The grouping script was implemented independently, without copying the upstream neural network. The independent audit does not import the grouping script either. It reconstructs confidence using the binary sigmoid identity and recalculates each group’s numerator and denominator. Agreement between the two implementations is a stronger check than calling the same function twice.
Minimum Experiment and Data Boundary
The model is fixed to DistilBERT SST-2, and the revision is 714eb0fa89d2f80546fda750413ed43d93601a13; the data is fixed as Stanford SST-2, and the revision is 8d51e7e4887a4caaa95b3fbebbf53c0490b58bbb. Validation is sorted by predetermined identity hashing, and the first 256 articles constitute an exploration pool. Subsequent calibration pools and protocol audit pools have no reasoning in this article, and IMDb has not read predictions. SST-2 has been used in historical projects, so rearrangement cannot make it a test set that has never been touched.
The input file also holds data identities, text hashes, original tags, logits, probability, prediction categories, correctness and token length. The official 256 logs inherit the first fixed version; today's new ones are group analysis and eight real models, and do not claim to re-inference all the samples. No training, threshold optimization, or model selection by result. The original statement is not packaged with the source code, and the data card license is still marked unknown, and the reader downloads and checks the hash through a fixed version. Data card
The forward time of the eight re-running model is about 0.069 seconds, and the total time after the import is about 0.489 seconds, and the peak process memory is about 7.95 billion bytes; the group analysis is about 0.002 seconds. They are single measurements, not performance rankings. Re-run uses CPU, single-precision model and given thread configuration. The cache check includes model files, tokenizers, data files, configuration and code identities, and cannot be reused just by the same file name. The formal analysis also locks the predicted file hash; if the input is replaced, the script should fail immediately. Time-consuming, peak process memory, system and dependent version write run records, and the download time and history are officially at Inference Time.
Evaluation protocol and results
Of the 256 articles, two hundred and thirty-three articles are correct. The high-confidence collection contains 242 articles, of which 19 are wrong, and the conditional error rate is about 7.85%. This number cannot be read as "every high confidence sample has the same error probability", it is just the observation ratio of this batch.
| Grouping | all samples | High Confidence Sample | High confidence error | Conditional error rate |
|---|---|---|---|---|
| Short | 54 | 51 | 6 | 11.76% |
| In | 140 | 138 | 5 | 3.62% |
| Long | 62 | 53 | 8 | 15.09% |
| original negative label | 130 | 123 | 13 | 10.57% |
| original forward label | 126 | 119 | 6 | 5.04% |
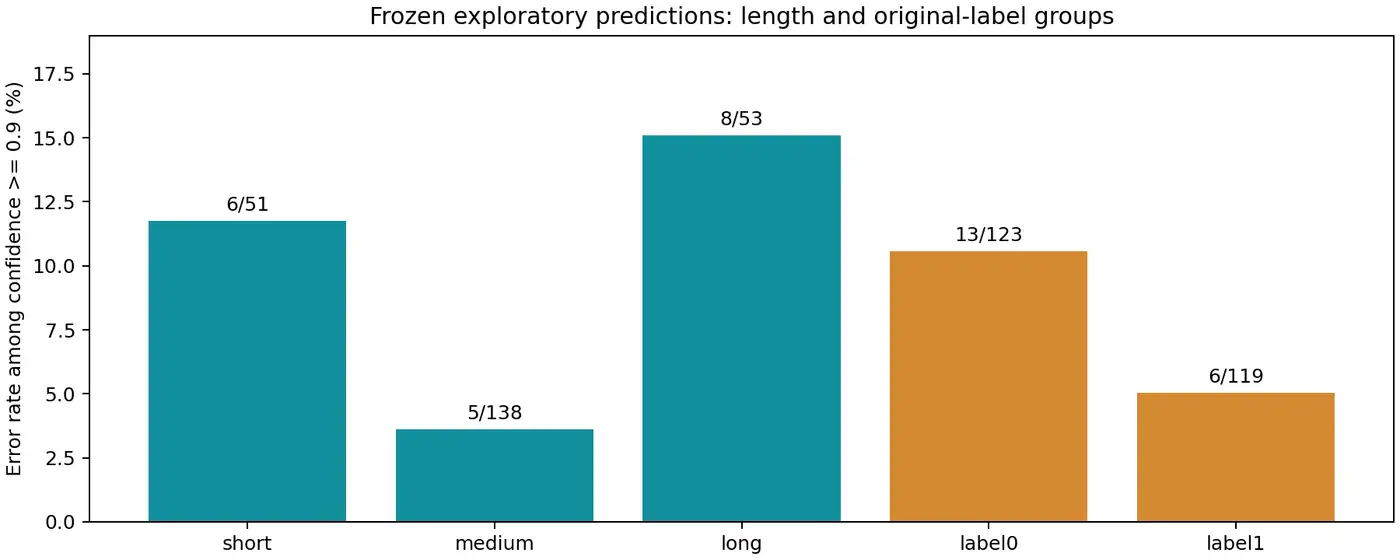
This figure is drawn by Matplotlib read saved group logs, and the number of errors and high confidence denominators is marked on the top of the column; no uncalculated error bar is drawn.
The length groups are mutually exclusive, and the label groups are mutually exclusive; the two axes cannot be added together, otherwise the calculation of the samples will be repeated. This actual verification shows that the medium-length group has the most samples, but the error rate is the lowest; the short and long groups are higher. Therefore, "incorrect rate increases monotonically with length" is not a suitable description here. The long group contributed eight high confidence errors, accounting for about 42% of the nineteen, and it accounts for about 20% of the high confidence samples. This is a checkable meaning of "concentration".
The cross group further shows that the short negative direction is four divisions and twenty-nine, the short positive direction is two divisions and two two; There are only one to five errors in each category, and one sample can significantly change the percentage. We do not declare significant differences according to the grid, and do not choose subgroups that need abstention, and do not use primitive emotional tags as population groups or safety tags.
The original number of the highest confidence error is 791, 282, 92, 829, 494, corresponding to Confidence About 0.99979, 0.99868, 0.99852, 0.999800, 0.99737. The length covers 11 to 46 tokens, and there are both types of original labels. This list provides a deterministic check-in entry, which does not constitute semantic classifications such as "sarcasm", "negation" and "label noise".
Failure investigation: Don't make auditing an illusion of interpretation
The first type of failure is to delete low-confidence samples from the denominator, but still call the indicator an overall error rate. The second category is to look at the wrong sentence first, and then the invention only covers the categories of these sentences; this will allow the group to define the absorption answer. The third category is to describe the token length as the amount of information or the difficulty of understanding: the tokenization granularity, punctuation and proprietary words may change the length, and the correlation cannot be directly attributed to the context ability.
Another type of failure comes from implementation details. The length boundary must be written clearly, the original label and the prediction label cannot be mixed, and the order of the highest confidence error must be stable. The recalculation should check the identity and arithmetic at the same time, otherwise the correct results of the other set of samples should be pasted, and it may also pass the check that only compares the mean. Here, recalculate the category and Confidence for all rows, and then check each group of error numbers to avoid only proofreading the final percentage.
At present, there is no new labor gold standard, and there is no modification to the label. If these errors are to be said in the future due to irony or annotation, it is necessary to formulate a semantic guide, prepare the pending materials and obtain the real audit results, and the automatically generated interpretation cannot be used as evidence. This step does not require this step to complete deterministic grouping, but it does not use this to cross the boundaries of semantic judgment.
Code and instructions for reproducing the results
Fixed versions published in this article: Source directory、README、SOURCE_MAP. The public copy is consistent with the local distribution list, and the file hashing is the same, and has passed the independent recalculation and the real model test run.
The minimum analysis command is python analyze.py && python check_analysis.py, generate twelve sets of statistics, list of highest confidence errors, independent audit records and resource records. The real model reproduces the entrance to python execute.py prepare --cache .cache112, and then execute python execute.py smoke --cache .cache112; use the full range formal action. Dependency, resource lock, segmentation list and baseline reasoning module are all included in the supporting source code, and do not depend on the private module of the author's machine.
It is recommended to read the product in three layers when recurring. The first layer checks the resource lock and the division list, and confirms that the same data version and the same set of numbers are obtained; the second layer checks the probability, prediction and length of the sample-by-sample probability, whether the positioning abnormality comes from tokenization, or the model is misaligned; the third layer only compares the grouping. If the first layer is different, even if the final error rate is close, it cannot be called the same experiment recalculation. This sequence is especially suitable for readers who are just starting to do scientific research: first let the differences be positioned, and then discuss whether the results are meaningful.
Every cross-classified group in this audit contained errors, though a finer subgroup could easily have none. Observing zero errors in a small sample does not establish zero risk or justify using a list of groups directly to decide when to abstain. A different confidence threshold would also change which examples are accepted. Its error rate would be conditional on a different set, so a change in percentage cannot all be credited to a better model. We froze the threshold to keep this investigation focused on the groups themselves.
Research questions and summary
The lower error rate among medium-length examples is worth tracking, but the evidence cannot separate the effects of content, class mix, and length itself. To test the length hypothesis, fix a matching or stratification plan and validate it on independent data available for that purpose. Dropping long examples now or searching for cutoffs that make the curve monotonic would undermine that test. The current list can generate a hypothesis. Confirmation needs separate evidence.
The new product in this article is an error map that can be independently restored from the real Logits. Confidence, which is close to full marks, may still correspond to errors; the proportions of errors in different groups are also inconsistent. Retaining the complete group, denominator, fixed rules and historical contact descriptions, so that these phenomena can be the objects that can be challenged in subsequent research, more reliable than the general flaws of the five cases that are described as the model into the model.
References
Search date: 2026-10-31. The paper report and official model description and this actual analysis are marked respectively, and the dynamic list numbers are not cited.
- Chuan Guo、Geoff Pleiss、Yu Sun、Kilian Q. Weinberger,2017,ICML: On Calibration of Modern Neural Networks.
- Hugging Face: DistilBERT SST-2 Model Card.
- Stanford NLP: SST-2 Data Card.
- Hugging Face: Fixed Submitted Classifier Implementation.
Apps by the author
The following is the author's own product promotion. In addition to writing scientific research blogs, I also independently develop small tools that make daily routines more organized: Daily Expense Journal Used to record revenue and expenditure, arrange budgets and save goals, View on the App Store; One Small Action Help choose daily small actions according to time and energy, and record how you feel after completion, View on the App Store. More technical articles and personal works, welcome to visit Author personal website. These product introductions are independent of the experimental and research conclusions of this paper.