
Date:2026-07-26
Who this is for: Graduate students in AI, NLP, machine learning direction; new scientific research candidates who are preparing intensive reading, recurring reports, group meeting reports or topic selection; technical readers who have engineering background and hope to upgrade "see score" to "judgmental strength"
search date:2026-07-26
Abstract
The experimental part of the AI paper is often read as "who has the highest score". This is a dangerous reading. The experimental table is not a screenshot of the ranking list, but the paper is used to support the research chain of evidence in the study of claim: whether the data set corresponds to the problem, whether the indicators measure the ability claimed by the author, whether the baseline is fair, and ablation Whether the variables are really isolated and whether statistical significance is sufficient to exclude random fluctuations. As long as one of the rings is broken, the bold numbers in the main table may lose explanatory power.
This article gives a set of reading methods for scientific research training. We do not start with "the highest row of the table", but start with "what the author has to prove", and then press the five layers of DataSet, Metric, Baseline, Ablation, and Statistical Significance to check the evidence. The article will combine NeurIPS / ICLR / AAAI review and reproduction specifications in recent years, Datasheets for Datasets, Model Cards, HELM, Dror, etc. Papers for Significance Testing, Reimers and Gurevych Experiments on Multiseed Distribution, Henderson The research on the reproducibility of deep reinforcement learning shows how to read the experimental part as a reproducible, questionable and extensible research object.
Contents
- Why can't you just look at the highest score in the experimental part?
- Five layers of evidence chain in the experimental section
- Dataset: first determine whether the data carries the problem
- Metric: Whether the indicator measures the ability or the proxy variable
- Baseline: fairness is more important than strong Baseline
- Ablation: not "delete module", but control variables
- Statistical significance: from single point score to distribution and uncertainty
- Methods / Experimental Review Form
- Reproduction suggestion: turn the experimental part into a reproduction plan
- Common misconceptions
- Research questions for graduate students
- Summary
- References
Why can't you just look at the highest score in the experimental part?
Many paper readers will first turn to the experimental table to see if the Proposed method exceeds the baseline, and then go back to the method of reading. This habit can quickly judge the general idea of the paper, but cannot judge the quality of the paper. Because what the experimental part really wants to answer is not "whether the score has risen", but "whether the score is enough to support the author's research claim".
For example, a paper claims to propose a better Reasoning method. If it only improves a little bit on a Benchmark that is easily contaminated by training data, and does not report sampling strategies, SEED, reasoning budgets, problem versions and error analysis, then it is difficult to indicate that the mechanism is effective. Another example is a paper claiming that the model is more robust, but only reports the average accuracy, and there is no distributed data, subgroup indicators or disturbance tests, so the experiment does not actually cover the "routifiable" claim.
The difficulty of the experimental part is that DataSet, Metric, Baseline, Ablation and statistical tests affect each other. The data set determines the boundary of the task, the indicator determines what behavior will be rewarded, the baseline decides the comparison object, the ablation determines the mechanism, and the significance test determines whether the difference is reliable. As long as one link is not set properly, the reader may misread accidental, local or incomparable differences as a method contribution.
This is why the 2025-2026 mainstream meeting is increasingly stressing experimental disclosure and reproducibility. AAAI-26 Reproducibility Checklist clearly requires authors to describe dataset selection motivation, indicator definition, SEED, hardware and software environment, number of runs, variability information and statistical test. ICLR 2026 Reviewer Guide also requires review to judge whether the paper has experimental rigor, reproducibility, and whether the results support claim. NeurIPS 2026 Evaluations & Datasets Reviewer Guidelines puts forward clearer review criteria for review tools, benchmark, Datasets, and negative results. In other words, reading the experimental part is not only the reading skills of the paper, but also a set of basic training to enter the modern AI research community.
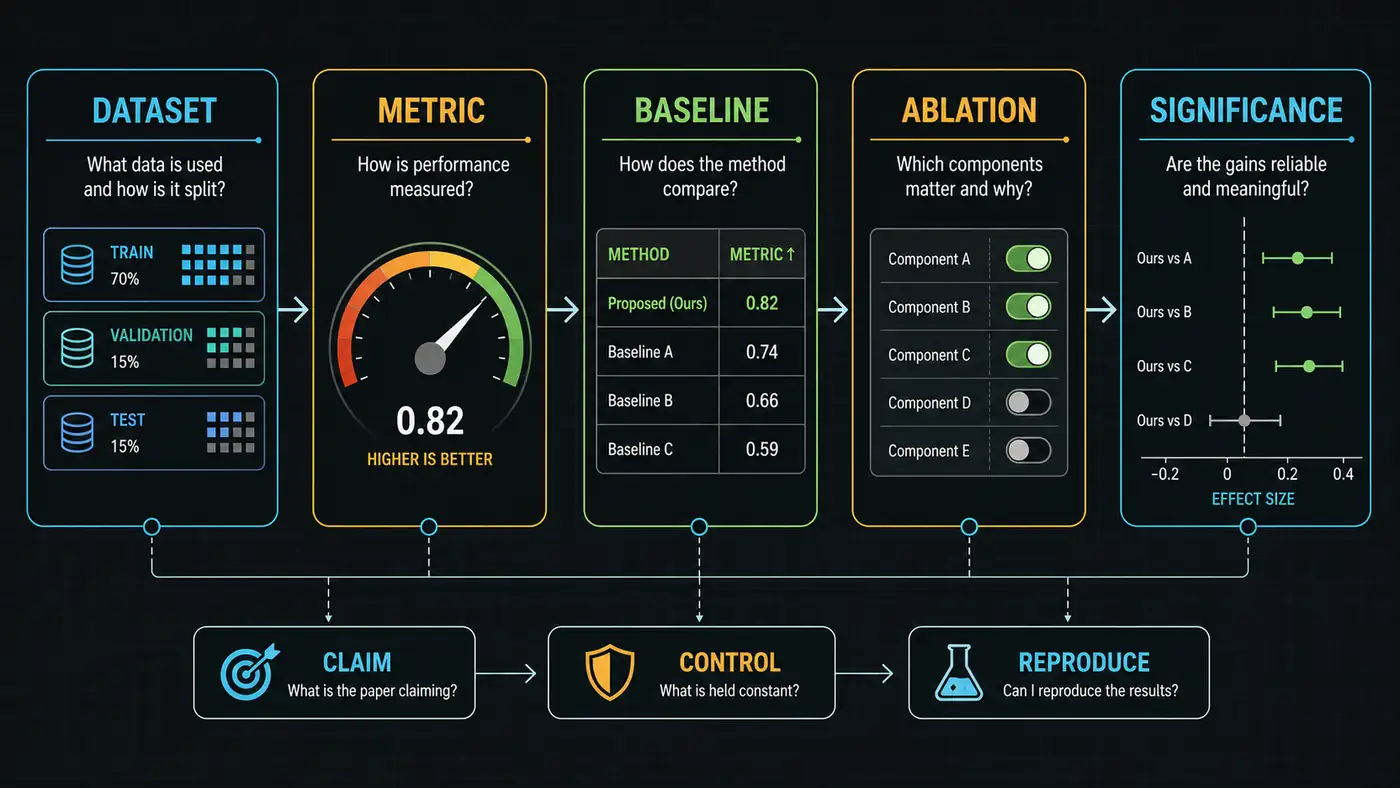
Five layers of evidence chain in the experimental section
When reading the experimental part, it is recommended to write the center of the paper first, and then check it along the five-layer evidence chain.
The first floor is dataset: Whether the data really represents the problem to be solved by the paper, training/verification/testing is reasonable, and whether there is a leak or selective use. Datasets are not background materials, but the applicable boundaries of experimental conclusions.
The second floor is metric: Whether the indicator corresponds to the author's claimed ability. Accuracy, F1, BLEU, ROUGE, Pass@K, Win Rate, Human Preference, LLM-as-judge Score, Calibration, Robustness, Latency, Memory Footprint all measure different objects. If the indicator is wrong, the higher the score, the more misleading it is.
The third layer is baseline: Compare whether the object is fair. Strong baseline is very important, but more important is the same data, the same budget, the intensity of the synchronous parameter, the same reasoning settings, and the same evaluation script. Otherwise, the main table is comparing the system configuration, not the comparison method.
The fourth floor is ablation: whether ablation isolates the core variable. The real ablation should answer "what the component changes through what mechanism", rather than simply deleting the modules one by one.
The fifth floor is statistical significance: Whether the difference is large enough to exceed random fluctuations, noise and data sampling errors. For deep learning and LLM research, a single number of runs is often insufficient; better evidence includes multi-seed, confidence interval, bootstrap, pairred tests, effect and error distribution analysis.
These five layers can in turn form your reading order: don't start with the highest score in the table, but start with claim; don't just ask "how much has been improved", but ask "what data, what indicators, what baseline, what control variables and what uncertainty is improved”.
Dataset: first determine whether the data carries the problem
When reading DataSet, the first step is to write the data set into a complete sentence: where the data comes from, what samples are included, how the labels are generated, how to divide the training/validation/test, why the paper chooses it, and what is its limitation.
Taking traditional classification tasks as an example, dataset problems include category distribution, sample deduplication, labeling consistency, whether the training test source is independent, and whether the preprocessing is only fitted on the Training Set. Take LLM Benchmark as an example, but also check the question version, prompt format, whether fEW-SHOT is allowed, whether there is chain-of-thought, whether it may appear in pre-training corpus, whether to use hidden test set, whether there is a Benchmark contamination. The next article will specifically discuss the Benchmark trap. This article first emphasizes a principle: the dataset is not a list of "what Benchmarks are used in the paper", but the scope of application of each conclusion.
The core value of Datasheets for Datasets is that it transforms Datasets from "downloadable files" to research objects that need to explain motivation, collection process, composition, preprocessing, use, distribution and maintenance. Hugging Face Dataset Cards also continues a similar idea, requiring the data card to describe the data content, context, deviation, purpose and metadata. When reading the paper experiment, you can reverse these documents as a checklist: if the paper is an open Dataset, whether the correct version is cited; if the paper constructs new data, it is No descriptions of sampling sources, filtering rules, licensing, annotation processes and failure cases; if the paper uses private data, whether the public data is not enough, and how the results can be reviewed.
Splits are most often missed when graduate students study DataSets. Training Set, Validation Set, and Test Set are not only three file names, but an experimental system that prevents researchers from leaking parameter tuning information to the final evaluation. For small data, medical data, multi-subject data, time series, code data and multimodal data, split The method is more critical: random division by samples may allow the same patient, the same repository, the same video, the same document or similar topics to appear in training and testing at the same time, thereby overestimating generalization.
Reading DataSet can use this checklist:
- Whether the data source is traceable, whether there is an official link, version number and license description.
- Training, validation, and testing whether the division matches the paper claim.
- Pre-processing, deduplication, filtering, or not using only allowed information.
- Whether the category, language, field, difficulty, length, and modal distribution are reported.
- Whether the new dataset has a data card, annotation protocol, annotation quality and ethics/private description.
- Private data or hidden test sets provide adequate review paths.
If these questions are not answered, the experimental results can still be used as clues, but should not be used as strong evidence.
Metric: Whether the indicator measures the ability or the proxy variable
The role of Metric is to turn research questions into comparable numbers. But indicators are always just proxy variables. When reading the experimental part, you have to ask: What behavior does this indicator reward and ignore, and whether it will encourage the model to take shortcuts.
In the classification task, Accuracy is intuitive when the category is balanced, but may mask a minority class failure when the category is extremely unbalanced. F1 is more concerned with the balance between precision and Recall, but the meaning of micro/macro/weighted F1 is different. In the retrieval task, Recall@K, MRR, and nDCG focus on the sorting position and candidate sets. In the code task, pass@k will vary with the number of samples and the quality of the test case. In the generation task, N-gram indicators such as BLEU and ROUGE are easy to underestimate semantic equivalent expression, and may also overestimate templated output. Win Rate, Human Preference and LLM-as-judge in the open LLM review will also introduce review preferences, sequential deviation, length deviation, and Judge model stability issues.
The important inspiration of HELM is that the evaluation of large models should not only look at a single accuracy, but should measure models across scenarios and multi-index, including accuracy, robustness, calibration, efficiency, fairness and other dimensions. When reading the paper, this means that you can't just look at the most emphasis on the author's most emphasis, but also check whether there are cost indicators and reverse indicators. For example, a method improves the inference accuracy, but significantly increases the inference token, delay and cost; a model improves the average score, but degrades on safe, calibrated or minority groups; a search enhancement method improves the accuracy, but the citation loyalty declines.
Metric is also aligned with the claim. If the paper is "more efficient", the main table should not only report Accuracy, but should also report training costs, delayed inference, video memory, throughput or energy consumption. If the claim is "more reliable", there should be Confidence, calibration, failure rate, stress test or out-of-distribution evaluation. If CLAIM is "more interpretable", it cannot only report task performance, but also requires loyalty, stability, manual evaluation or intervention experiments.
When reading metrics, you can label each indicator in three categories:
- target ability: It tries to test what abilities.
- Agency Risk: What shortcuts the model may use to increase the indicator.
- Missing dimension: It does not expect any important attributes.
These three tags allow you to go from "score reading" to "evidence reading".
Baseline: fairness is more important than strong Baseline
Baseline is the easiest part of the experimental part to create illusions. A paper can be beautifully improved by choosing a weak Baseline, and you can also gain incomparable advantages by giving your method more data, more parameter adjustment, and more reasoning budget. The core of reading Baseline is not asking "Is Baseline a name", but "is it fair to compare".
Fair Baseline to check at least six things.
First, whether the task is the same. Input and output, data division, prompt, context length, tool permissions, retrieval library, and training labels should all be consistent. If this method uses additional retrieval of documents, and Baseline does not allow retrieval, the comparison is no longer a comparison of the model itself.
Second, whether the data is the same. In particular, post-LLM training, preference optimization, Reasoning and Multimodal papers, additional synthesis data, filtering data, distillation teacher and private data often affect the results more than the method module itself.
Third, whether the model size and pre-training background are comparable. The small model method exceeding the old baseline is not equal to the strong method mechanism, it may be that the backbone is stronger.
Fourth, whether the training budget is comparable. Steps, Tokens, Batch Size, GPU, parameter adjustment, and early stopping standards should be disclosed. The entries for hyperparameter search range, selection criteria, final parameters, computing environment and SEED in the AAAI-26 Checklist are to reduce this kind of incomparable.
Fifth, whether the Reasoning budget is comparable. Reasoning, Agent, Code Generation and Tool-use Special attention should be paid to the paper: Temperature, top-p, number of samples, self-consistency, search, reranking, verifier, and the number of tool calls will change the result. If Proposed method uses pass@64 or most votes, and baseline uses greedy decoding, the main table must be explicitly stated.
Sixth, the evaluation script is consistent. Indicator implementation, tokenization, answer normalization, case processing, Invalid output processing, and duplicate sample processing can all change the score.
Strong baseline is worthy of encouragement, but fair baseline is more important. ICLR 2026 Reviewer Guide clearly mentioned that failure to reach SOTA itself does not constitute a reason for rejection; what the paper really needs to prove is whether it brings new, relevant and credible knowledge. Therefore, readers should not equate "not SOTA" simply as "worthless", but to see if the baseline design is enough to support the specific claim of the paper.
Ablation: not "delete module", but control variables
Ablation is often misinterpreted as "delete each module and see that the score drops". This is just the thickest form. Ablation, which has real research value, should serve the mechanism interpretation: it is to explain which components are important, why, under which conditions, and whether there are alternative interpretations.
Start with the paper’s central hypothesis. If retrieval is claimed to reduce hallucinations, look for a no-retrieval condition, variation in retrieval quality and document count, deliberately incorrect retrieval, and joint analysis of citation faithfulness and answer accuracy. If low-rank adaptation is claimed to suffice for task transfer, look for different ranks and insertion layers, frozen versus unfrozen comparisons, and controls on parameter count and training budget. If process supervision is claimed to improve reasoning, separate the effects of final-answer supervision, process labels, the verifier, sample count, and search strategy.
A good ablation has three characteristics.
first, vary one factor at a time. Change one key variable per experiment and hold the others fixed as far as possible. If removing a module also changes the parameter count, training steps, input length, or inference budget, the ablation cannot isolate the module’s effect.
second, explain the direction of the effect. Go beyond reporting that removing a component lowers the score. Identify the examples, metrics, and error types that change most. Otherwise the ablation can show that the component helps without explaining how it works.
third, report negative results openly. Some ablations yield no improvement or even expose limitations of the proposed method. The official description of NeurIPS 2026 MLRC emphasizes that rigorously documented negative results and partial failures to reproduce a finding can themselves be valuable scientific contributions. If a paper reports only favorable ablations and omits failed attempts, give its claims about the mechanism less weight.
As a reader, you can rewrite the ablation table into three columns: 作者想证明什么、消融是否隔离变量、还有什么替代解释. This is more training value than copying table numbers.
Statistical significance: from single point score to distribution and uncertainty
The common main table of deep learning papers is one row, one method, one column and one data set, and one number per grid. The problem is that single-point numbers mask the fluctuations of random SEED, data sampling, evaluation samples, unstable training and implementation details.
Reimers and Gurevych show the sensitivity of the Sequence Tagging system to random SEED in the EMNLP 2017 paper and advocates a Score distribution rather than a single score. Dror et al. systematically discussed the selection of statistical significance tests in NLP in ACL 2018, emphasizing That different task settings, evaluation indicators and sample dependencies will affect the test methods That should be used. Henderson waits at AAAI 2018 Deep RL That Matters It shows That the environment randomness, algorithm variance and reporting methods in Deep reinforcement learning will make the results difficult to explain, unless the author provides more rigorous experimental and statistical reports.
When reading statistical significance, do not use p-value as a universal certificate. You have to look at least five questions:
- Whether the paper runs more SEED or only reports it once.
- Whether the difference has Confidence interval, standard deviation, standard error, or bootstrap interval.
- Check if paired. For the output of two systems on the same Test Set, the paired test is usually more appropriate than the independent sample hypothesis.
- Whether to report the amount of effect. A statistically significant but very small improvement may not have research significance.
- Whether multiple comparison controls are performed. There will always be some occasional remarkable in a large number of Benchmark/Metric/Ablation.
For LLM reviews, pay extra attention to Judge variance and review repetition. If it is Human Evaluation, check the number of labels, agreements, blind evaluations, inter-annotator agreement, sample size and sampling method. If it is LLM-as-judge, check the JUDGE model version, prompt, sequential randomization, repeated evaluation, and manual verification. The model name, version and API behavior is a changeable information, and the official document or project repository should be re-checked before publication; this article is only organized according to the accessible source of 2026-07-26.
A practical principle is that if the improvement of the paper is less than the common SEED variance or the confidence interval is severely overlapped, don't read it as a deterministic victory. A more reasonable statement is "there are positive signs under this experimental setup, but the evidence is limited".
Methods / Experimental Review Form
After reading the experimental part, it is recommended to force the output of the following table. It can dismantle the paper from "the result seems to be good" to be censored evidence.
| review layer | Key issue | What does strong evidence look like | risk signal |
|---|---|---|---|
| Claim | What the author claims to solve | CLAIM corresponds to the experimental settings item by item | The main table is not a claim |
| Dataset | Does the data represent the problem | Version, source, split, preprocessing, clear limitations | Private data, leak risk, SPLIT unknown |
| Metric | Whether the indicator detects the target ability | Multi-indicator coverage accuracy, robustness, cost or safety | Only the most favorable indicators |
| Baseline | Is the comparison fair? | Same data, same budget, same inference setting, same evaluation script | baseline is too old or insufficient |
| Ablation | Whether to isolate core variables | Univariate control, error analysis, transparent negative results | Delete the module and change multiple conditions at the same time |
| Significance | Is the difference reliable | Multiple SEED, CONFIDENCE INTERVAL, Paired Tests, effect amount | The best result in a single time, no variance information |
| Reproducibility | Whether the main result is reproduced | Code, configuration, data, weights, SEED, logs are complete | Only pseudocode or missing key configurations |
The last column of this table is especially important. It is not for thorns, but for training research to judge: which conclusions can be believed, which can only be used as inspiration, and which needs to be reproduced before citing.
Reproduction suggestion: turn the experimental part into a reproduction plan
After reading the experimental part, the next step is not to immediately reproduce it completely, but to translate it into reproduction plan.
The first step is to reproduce the evaluation script. If you don't train the model, use the paper publicly checkpoint or baseline output to run the evaluation, and confirm that the dataset, preprocessing, metric and the results format are consistent. Many recurring problems come from the evaluation entry, not the model code.
The second step is to reproduce the minimum baseline. Select a cost-controlled Baseline to pin SEED, environment, data version, and log formats. In this way, you have a local reference system, and then you will know whether the change of Proposed method is real.
The third step is to reproduce a core setting in the main table. Don't start chasing the full table at first. Prioritize the dataset and metric that best supports the claim, and record the configuration, commit, hardware, video memory, training time and intermediate metrics for each run.
The fourth step is to do a minimum ablation. Change only one key variable and repeat at least multiple SEEDs or subsets of data. If the budget is limited, the scale of the model can be reduced, but it is necessary to clearly state that this is a scale-down reproduction, and do not directly extrapolate small-scale conclusions to the size of the original paper.
The fifth step is to write uncertainty. The reproduction report should include success results, failure results, sources of deviations and items to be verified. NeurIPS MLRC 2026 attaches great importance to reproduction, promotion, negative results and evaluation audit, indicating that "serious failure" is also a part of scientific research training.
A good reproduction plan may not necessarily fully reproduce a large-model paper, but you must let others know what you have reproduced, what is not reproduced, why it is trusted, and where is not.
Common misconceptions
Misunderstanding 1: Treat Benchmark as a universal ability. The average score will smooth the task difference, sample difficulty and error type. Readers should check the results of sub-task, difficulty, sub-language, sub-domain and sub-input length.
Myth 2: Treat SOTA as the only value. A paper may not have the highest score, but proposes a clearer evaluation protocol, a more stable training method or a more reproducible negative result. The ICLR 2026 Reviewer Guide also emphasizes that the lack of SOTA results itself is not a reason to refuse.
Misunderstanding 3: Ignore the reasoning budget. In the Reasoning, Code, Agent, and Tool-Use studies, the number of samples, searches, validators, and tool calls can significantly change the results. The test-time compute must be confirmed when reading the form.
Misunderstanding 4: Use ablation as a mechanism to prove it. Module deletion leads to a decrease in the score, which only shows that the module is related, and does not automatically explain the mechanism given by the author correctly. Alternative interpretation, error analysis and control experiments are also required.
Misunderstanding 5: Just look at Statistical Significance, not the effect amount. Small differences may also be significant under large samples, but may not have research significance; in small samples, they may not be effective. Scientific research needs to combine effects, variance, costs and claims.
Misunderstanding 6: Equivalently reproducing the open source repository. Code disclosure is important, but also requires data versions, environments, training commands, review scripts, weights, logs, and random seeds. In Papers with Code's research Code release recommendations, dependencies, training codes, evaluation codes, pre-trained models and result reproducing commands are the key components.
Research questions for graduate students
Study on the results stability of multi-seed and multi-data subsets: Select a popular LLM or multimodal Benchmark to compare ranking changes under single SEED, 3 SEED, BOOTSTrap and different test subsets.
Indicator sensitivity analysis: Compare the Accuracy, macro-F1, Calibration, Latency, Token Cost, Human Preference or LLM Judge on the same task, and observe how the conclusion changes.
Baseline Fairness Audit: Select a group of recent papers, check whether the Baseline is the same as the data, co-tuning the budget, the same reasoning strategy, and give a reproducible audit table.
Ablation design reproduction: Reproduce a key ablation of a method paper, and add an alternative interpretation control experiment that the author did not do.
Dataset document quality research: Use the Datasheets/Dataset Cards' problem framework to review the Dataset of a certain field, and analyze which missing information is the most influencing the reproduction.
LLM-as-judge Variance Study: Fixed sample and system output, change Judge prompt, sequence, model version or number of repetitions, and measure and evaluate stability. When involving model version and API behavior, the search and call dates should be recorded in the experimental log.
The common features of these topics are controllable scale, basic training and scientific research skills, and easy to form a reproduction report or workshop paper, which can also help you transition from "reading papers" to "evaluation evidence".
Summary
The core of reading the experimental part is not to remember which method is the highest in the table, but to judge whether the evidence chain supports the paper claim. Dataset determines the boundary of the problem, Metric determines the measurement object, baseline determines whether the comparison is fair, the ablation determines whether the mechanism is established, and the statistical significance determines whether the difference is reliable.
For graduate students, the most valuable training action is to rewrite the experimental part into three materials: one Evidence Table, one Reproduction Plan, and one set of problems to be verified. Reading the paper in this way will not only repeat the author's conclusions, but also know where the conclusion is strong, where it is weak, how to reproduce, and how to further ask your own research questions.
The next article will continue to move forward: how to identify the Benchmark trap in the paper, focusing on data leakage, selective reporting and non-reproducing results.
References
Search date: 2026-07-26. The following priority lists first-hand information, official pages, paper pages or project homepage; meeting rules, model versions, code repository status, benchmark results and dataset versions may change. It is recommended to manually verify before official release.
- AAAI-26 Reproducibility Checklist, AAAI official page, 2025. https://aaai.org/conference/aaai/aaai-26/reproducibility-checklist/
- ICLR 2026 Reviewer Guide, ICLR official page. https://iclr.cc/Conferences/2026/ReviewerGuide
- NeurIPS 2026 Evaluations & Datasets Reviewing Guidelines, NeurIPS official page. https://neurips.cc/Conferences/2026/EvaluationsDatasetsReviewerGuidelines
- MLRC 2026: Reproducibility as an Official Track at NeurIPS, NeurIPS Blog, 2026-05-04. https://blog.neurips.cc/2026/05/04/mlrc-2026-reproducibility-as-an-official-track-at-neurips/
- Joelle Pineau et al. “Improving Reproducibility in Machine Learning Research: A Report from the NeurIPS 2019 Reproducibility Program.” JMLR, 2021. https://www.jmlr.org/papers/v22/20-303.html
- Timnit Gebru et al. “Datasheets for Datasets.” Communications of the ACM, 2021; arXiv version 2018. https://arxiv.org/abs/1803.09010
- Hugging Face Hub Documentation: Dataset Cards. https://huggingface.co/docs/hub/datasets-cards
- Margaret Mitchell et al. “Model Cards for Model Reporting.” FAT* 2019 / Google Research page. https://research.google/pubs/model-cards-for-model-reporting/
- Hugging Face Hub Documentation: Model Cards. https://huggingface.co/docs/hub/model-cards
- Percy Liang et al. “Holistic Evaluation of Language Models.” HELM project page. https://crfm.stanford.edu/helm/latest/
- Rotem Dror, Gili Baumer, Segev Shlomov, Roi Reichart. “The Hitchhiker’s Guide to Testing Statistical Significance in Natural Language Processing.” ACL 2018. https://aclanthology.org/P18-1128/
- Nils Reimers and Iryna Gurevych. “Reporting Score Distributions Makes a Difference: Performance Study of LSTM-networks for Sequence Tagging.” EMNLP 2017. https://aclanthology.org/D17-1035/
- Peter Henderson et al. “Deep Reinforcement Learning That Matters.” AAAI 2018. https://ojs.aaai.org/index.php/AAAI/article/view/11694
- Papers with Code: Tips for Publishing Research Code. https://github.com/paperswithcode/releasing-research-code
- OpenAI Evals repository. https://github.com/openai/evals