
- Date: 2026-10-13
- For graduate students, early-career researchers and research engineers
- Scope: Two training checkpoints for the same small model, and 64 existing development samples; exploratory analysis, not a complete benchmark ranking.
Summary: What is the leading question?
The two results are 58 correct questions and 57 questions correct. The leaderboard will put the former on it, but will not tell us: do they have their own strengths, or are they only different on the same topic? These two situations can have the same average difference, but the supported research judgments are very different.
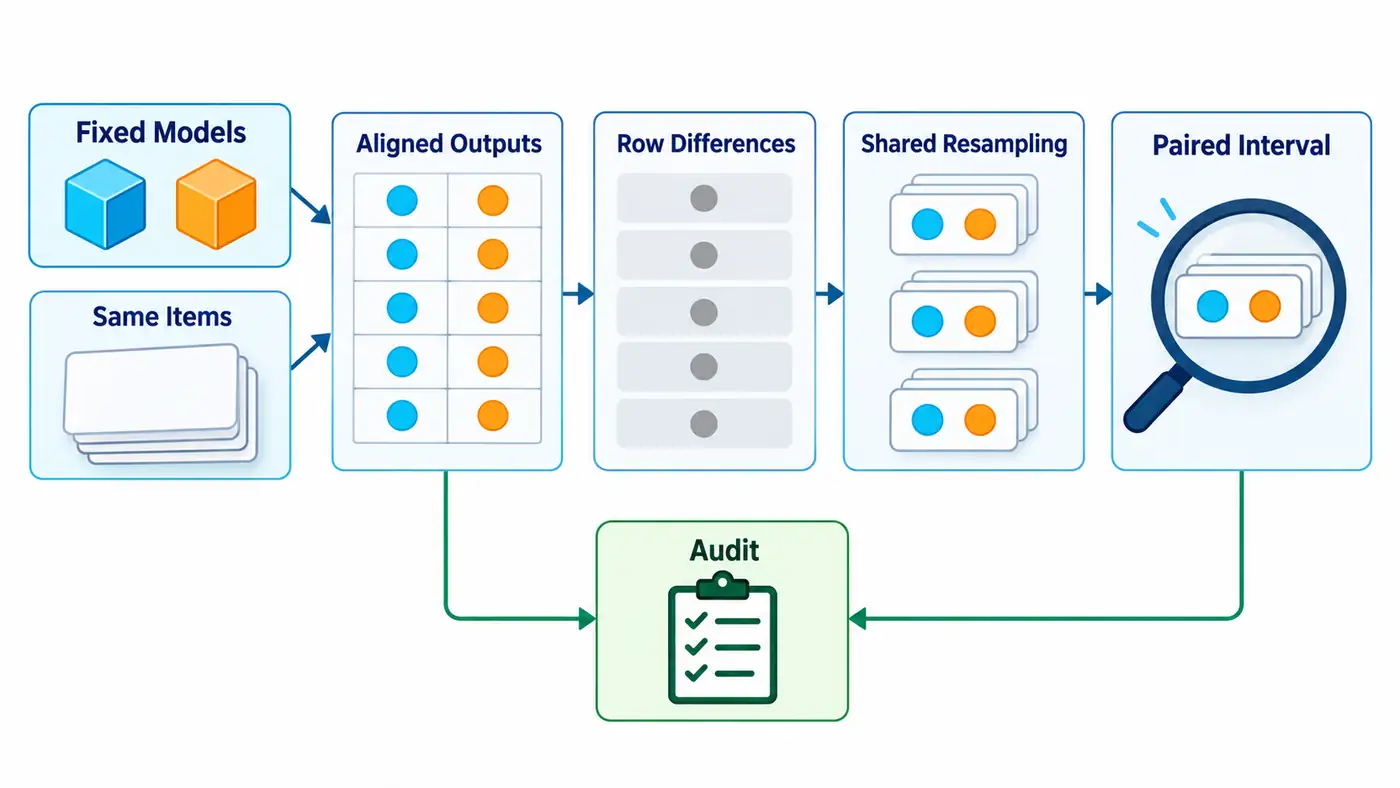
This article reuses the two real checkpoints obtained from the previous training, regenerates the answers of the same batch of SST-2 emotional classification samples, and then uses the matching interval to check this gap. The actual result is: the latter is 0 wins, 1 loss, 63 draws, and the difference is 1.5625 percentage points. The pairing percentage interval is negative 4.6875 to 0 percentage points; the wrong control of the breaking corresponding relationship is negative 12.5 to positive 9.375 percentage points. The narrowing of the interval indicates that it is important to retain the corresponding relationship, but there is only one disagreement, and it cannot be declared that a stable victory or the two models are equivalent.
Reproducing value: undertake scoring audit, and ask for uncertainty
In the previous article, the boundaries of the answer extraction rules and manual review were reviewed; there has been an overall review and confirmation, but no question labels have been provided, so the manual misjudgment rate is still unknown. This article does not regard the confirmation as a computable artificial gold standard, nor does it re-select the scorer. We return the existing training items, freeze the joint metrics with the correct JSON format and the correct tags: only the output is the specified JSON object, and the unique emotional tag matches the data label, which is counted as correct.
There is only one new question: When the two models are doing the same set of questions, how should the uncertainty of the average difference be described? What is changed is the statistical resampling method, and the frozen ones are checkpoints, data, prompts, decoding and scoring. Matching means that each question retains the results of two models at the same time; self-service resampling, also known as bootstrap, refers to a sample that is put back from the observed unit, and these repeated samples are used to observe the changes of the statistics.
The two models here are the checkpoints obtained by the same basic model through different training sequences, not two architectures or two vendor systems. The previous results have been made public, we take the first two rearrange checkpoints according to the seed number, and are not qualified to call the choice pre-existing blind selection. This interval is used to understand the existing development results and cannot replace the final confirmation evaluation.
Core thought and formula: match first, then find the difference
For question , let the joint correctness of the two models be , fixed with b minus a:
Among , Only negative one, zero or one, respectively, means B loses, draws, and wins. The percentage difference is obtained after the percentage is multiplied by 100. The shapes of the two correct arrays are , the difference array is also ; Can't splice two arrays claim to have 128 independent observations.
Each resampling generates a set of row indexes , the two models must share them:
The asterisk indicates that there is a statistic for putting back resampling at a time, from the original Extract evenly. We fixed 20,000 repetitions, random seeds 9800, and took 2.5% and 97.5% linear quantiles of the difference distribution. The percentile method is explicitly selected here, which is convenient for reviewing each step, and does not claim that it has accurate coverage under small samples.
Why is it inappropriate to draw two arrays independently? Under the independent row assumptions:
Represents two correctness on the same random question, and the covariance describes the degree of common answer or wrong answer between the two. Break the pairing will lose this item. In this case, the two are highly in the same direction, so the wrong drawing method gives a wider interval; if the covariance is negative, the direction may be opposite, and "pairing will always be narrower" as theorem.
Guide to the official implementation: the protocol behind one parameter
At the dissertation level, Dror et al. discussed how tasks, metrics and experimental settings influence statistical test options in ACL2018; it did not report the results of the two checkpoints in this paper. [1] At the implementation level, we use the official Bootstrap interface of SciPy 1.13.1. Read the parameter verification function first: after opening the pairing, it converts the data into a shared row index; then read the resampling function; finally reads the calculation of the percentile and standard error. [2]
The most likely to miss is the default value: the official default method is BCa, and this article explicitly specifies the percentile method; the random state is also clearly passed into the Generator of NumPy. Only the function name is copied without saving the parameters, and the result may be changed by running again. The source map gives a fixed commit, function and line number, and records that the official file is the same as the installation file byte. Model generation continues to call the template, forward and build interfaces of fixed Transformers versions. [3]
The teaching script also uses direct indexing to check all 20,000 differences against the official implementation one by one. A separate audit script imports neither the production scoring code nor SciPy. It parses the outputs again, reconstructs the four-cell table, and uses the binomial distribution to recalculate the empirical resampling quantiles for this example. The first check can catch a misreading of the interface. The second can catch arithmetic errors in a shared implementation. Neither validates the assumptions about the population.
Minimum experiment: identity precedes score
The basic model is SmolLM2-135M-Instruct, the model and the tokenizer are locked in the same revision; the two checkpoints are from the in-class rearrangement training of seeds 93 and 94 respectively. [4] The original training used 32 samples, 64 updates and 1024 supervised tokens. This time, it is not retrained, but the hash of the checkpoint file is checked, and then the real weight is generated to answer.
The data follows 64 development samples in the fixed verification division of SST-2, and the labels are 31 negative and 33 positive. [5] The training order change has not changed the template, greedy decoding, up to 32 generation tokens or input upper limit. First do the resource test run of the two questions, and then execute the complete 128 generations; keep 128 SST-2 and 64 news confirmation samples, neither of which is reasoned.
The actual operation is completed on the CPU, single precision, and four threads. The newly output token, prompt hash, question number, and label are the same as the original cache, and only the measurement time is different. Each model inputs 5250 tokens and outputs 512 tokens, including the terminator. The first question input shape is , the model output tensor is , the last dimension is the size of the vocabulary. The official operation takes 22.675 seconds after importing dependencies, and the process peak resident memory is 1,677,852,672 bytes; the total wall clock time containing the process startup is 25.699 seconds. GPU memory is not measured because GPU is not used. Both the environment and resource data are from the real log.
The first test run card reads in the source code cache of the old cloud disk, and has not entered the reasoning. We keep the interrupt record and reduce the download verification list to the 11 models, tokenizer and validation set files necessary for this time, and the official source code is anonymously obtained for verification. There was no replacement of data or models, nor did the failure rounds be erased from the experimental history.
Cache identity also needs to be auditable. It is not enough to write only the model name: the model with the same name may have a new revision, and the Tokenizer template or decoding upper limit changes will also change the output. This package incorporates basic weights and tokenizer revisions, checkpoint hashes, data file hashes, prompt configuration, decoding rules, and code hashing into identity records. True reasoning and statistical replay each save commands, exit codes and input identities; readers can judge which batch of outputs they recalculate, instead of just seeing a total score that cannot be traced back.
Evaluation protocol and Actual Results: Open a Difference
| the same question | Number of questions | Contribution to B minus A |
|---|---|---|
| Both are correct | 57 | 0 |
| Both are wrong | 6 | 0 |
| A correct, B error | 1 | −1 |
| A error, B correct | 0 | +1 |
This table provides one more fact than the two averages: all the differences come from the verification question number 481. Both outputs satisfy the JSON format, the difference is emotional tags. There is only the difference between this question number and model, and semantic interpretations such as "negative sentences lead to unstable training sequences" cannot be deduced; then it is necessary to define the wrong category, prepare counter-examples, and test on new samples.
What we tested: A is 90.625% and B is 89.0625%; the matching interval is percentage points, independent error control is a percentage point. The 20,000 official resampling is exactly the same as the direct index, and the independent arithmetic resampling is also passed. The interval only describes the resampling sensitivity of the current two fixed checkpoints on this batch of development lines.
It must also explain why the upper bound is exactly zero. There is no line that B wins alone in the empirical sample, and resampling cannot produce this kind of line out of thin air. Therefore, this endpoint is not evidence that "B is generally not possible to be better in general". Only do bilateral precision binomial tests on inconsistent questions, there is currently only one failure, and . It means that under this symmetry and no advantage, an inconsistent direction does not provide evidence against the assumptions, which is not a null hypothesis is true; it also cannot prove that the two models are equal. Interval estimation, significance test and equivalent test answer different questions.
Failure investigation: first find the lost correspondence
The independent checker first rejects duplicate question IDs, missing pairs, mismatched labels, and misaligned prompt hashes. It then checks the scores against the raw text. Its eight checks include deliberately corrupting these fields and verifying that shuffling the records leaves the results unchanged. Subtracting scores by row number can yield a plausible mean even when the rows refer to different questions. Pairing by stable question ID preserves the comparison.
The second hidden danger is the observation unit. The current data interface does not have a movie or original comment group identification, and we can only publicly explain the assumptions of the condition of resampling by row. If the mapping of multiple sentences under a movie is obtained in the future, the entire group should be extracted and the sentences in the group should be selected. In the absence of group evidence, the extrapolation of the distribution of new movies in this interval remains to be verified.
The third hidden danger is the selection process. The development sample has participated in the analysis before, and Bootstrap will not automatically eliminate this selection deviation. Adding the number of repetitions from 20,000 to 200,000 can only reduce the approximate error of Monte Carlo, and cannot add new questions, and cannot make up for the unobserved mode of winning and losing. The fluctuation of the training seeds is also not within the interval of this article; to study the training program, the estimation objects that run across runs must be redefined.
Propose a verifiable research question from the results
The authors infer that the most worthy of addition in this case is the divergent structure on the new independent sample, not more decimal places. It can be verified that the hypothesis can be written as: "After the performance of the two checkpoints is still concentrated in a few questions after freezing scores and prompts?"
If you want to claim the equivalent, you should give the acceptable difference range before looking at the new results, and then choose a suitable interval or inspection; you can't see the contact zero in the interval, and it should be rewritten as "the effect is the same". The next step is to record all the candidate tips and scoring settings, keep the improvement options in the development set, and finally only confirm the freezing plan. This article does not open the reserve set in advance to make the story more complete.
Code and instructions for reproducing the results
The source code of this article has been disclosed and verified by file: Source tree at the pinned commit、README Running Instructions、SOURCE_MAP source map. The 54 distribution files are consistent with the local archive, and the downloaded independent recalculation and real model test run passed.
The minimum command is as follows, it only replays the saved real predictions, and does not generate new model answers:
python run.py --out replay-new
It is expected to get a question-wise pairing table, a summary, a resampling frequency and environmental records. README also tests the real model, the complete 128 output reconstruction, and the fixed source code acquisition command in the previous chapter; the model weight and original data are obtained through a locked source, which does not depend on the author's local path. Independent auditing, configuration, precise dependencies, failure instructions and licenses are delivered together.
Summary
The leading question is an observational fact. The scientific research report should also explain what kind of matching structure this question belongs to, what sampling assumptions it depends on, and which uncertainty is not covered. After retaining the corresponding relationship this time, we get a narrower interval, and we also see that there is only one boundary problem caused by differences. The reviewable conclusion is therefore a limited development set observation, not a new model leaderboard.
References
Retrieve and actually access the date: 2026-10-13.
- Rotem Dror、Gili Baumer、Segev Shlomov、Roi Reichart,2018, The Hitchhiker’s Guide to Testing Statistical Significance in Natural Language Processing,ACL; Full paper.
- SciPy developers, Bootstrap 1.13.1 official documentation; Pinned commit Implementation.
- Hugging Face, Transformers 4.49.0 fixed generation implementation.
- HuggingFaceTB, SmolLM2-135M-Instruct Fixed Model Card.
- Richard Socher et al., 2013, Recursive Deep Models for Semantic Compositionality Over a Sentiment Treebank; SST-2 fixed data card.