
- Date: 2026-09-20
- For graduate students, early-career researchers and research engineers
- Scope of reproduction: Temperature fitting, calibration indicators and Abstension protocol on synthetic two classifications; no reproduction of the original paper list.
Abstract
What does it mean when a model reports 90% confidence? Calibration asks whether, across many predictions with similar scores, the fraction correct is close to that score. It gives no guarantee about an individual answer and says nothing about whether the model understands its mistakes. Drawing on two papers and the authors’ code, we tested temperature scaling on a fixed analytical scoring function, then used the scores to decide when to abstain. Calibration error and risk at a fixed threshold can both fall while the system answers fewer questions. A shift in the conditional distribution can also make the original threshold unreliable.
Contents
- Reproducing Value and Paper Hypothesis
- Core ideas and formulas
- A guide to the official implementation
- Minimum experiment and operation method
- Evaluation protocol
- Actual results and explanations
- Troubleshooting and limits of the evidence
- Questions for further research
- Summary and References
1. Reproducing value and paper assumptions
What the paper reports. The ICML 2017 paper of Guo, Pleiss, Sun, and Weinberger studies the probability calibration of the neural classifier, and proposes to use a single temperature parameter for post-processing, and report validity on the measured image and text tasks. This is evidence under a specific model, data and division, and cannot directly replace the measurement of any large model today. Paper and full text
NIPS 2017 Work Discussed Selective Category with Geifman and El-Yaniv: Allows the model to reject a part of the input and exchange a lower acceptance set error rate. Its risk control demonstration relies on the conditions such as independent sampling of the same distribution, and also involves the upper bound of statistics. Low ECE itself does not constitute such a guarantee. Full paper
this goal. Without training large networks, directly construct traceable score distortions, answering three questions: whether the reasonable probability can be restored; whether to change the predicted answer and sample ordering; whether the improvement on the Calibration Set is enough to support the test set abstent. To reduce the training noise in this way, the price cannot be judged based on this why the real network is overconfident.
The core ideas and formulas
Logit is the category score before normalization. Divide the fraction vector of the sample by the positive temperature, and then pass softmax to get the class probability:
Here the fractional matrix is [n,K], labeled as [n], the temperature is a scalar; negative log-likelihood NLL measures the probability of allocation to a real label. This time, only the Calibration Set is used to fit the temperature, and the original score remains still. Positive temperatures do not change the maximum score category for a single sample; but that does not mean that the maximum probability ordering between all samples remains unchanged. formula source
Let Confidence be the maximum category probability, and divide it into the equal width interval, and the sample of Expected Calibration Error ECE is estimated as:
B_m It is the sample set corresponding to the number of fractional boxes, and the two mean values are ACCURACY and CONFIDENCE in the box respectively; the empty box contributes zero. It is an overall summary of the binning, not a single prediction reliability label. This time, the number of samples per box is saved, and the sum of the probability squared errors of NLL and the two types of probability is calculated at the same time, that is, the Brier score used in this paper.
The Abstention rule is only samples that accept only Confidence that is not below the threshold:
C is coverage, R It is to accept the set error rate, and the threshold is a scalar. When no sample is accepted, the risk is not defined, the code is written null, you cannot pretend to be successful with zero.
3. Guide to the official implementation
Read the author first temperature scaling Repository maintenance instructions, open again temperature_scaling.py. Look along three entrances: temperature_scale Broadcast scalars and divide logits; set_temperature Collect the verification score in the evaluation mode and no gradient state, and then let LBFGS only update the temperature; _ECELoss The weighted error is calculated according to the left and right closed interval, and the default is fifteen boxes.
The input here must be logits, and the normalized probability cannot be done as a softmax again. The current source code also has an explicit CUDA call. The temperature itself is a direct-declared parameter, and there is no positive value and parameterization. The local realization is to use the positive inverse temperature interval to find the root; this is the corresponding at the algorithm level, and there is no claim to run the old version of the official environment. The two repositories are read according to the master at the time of search, the submission is not locked, and the compatibility of subsequent versions is subject to manual verification.
Read again Selective classification repository and risk_control.py: first confirm residuals One represents an error, and then tracks the upper bound of the sorting, candidate threshold and binomial distribution. The empirical risk grid selection used in this paper does not realize the upper bound, and the high probability guarantee cannot be borrowed from the paper.
The minimum experiment and operation method
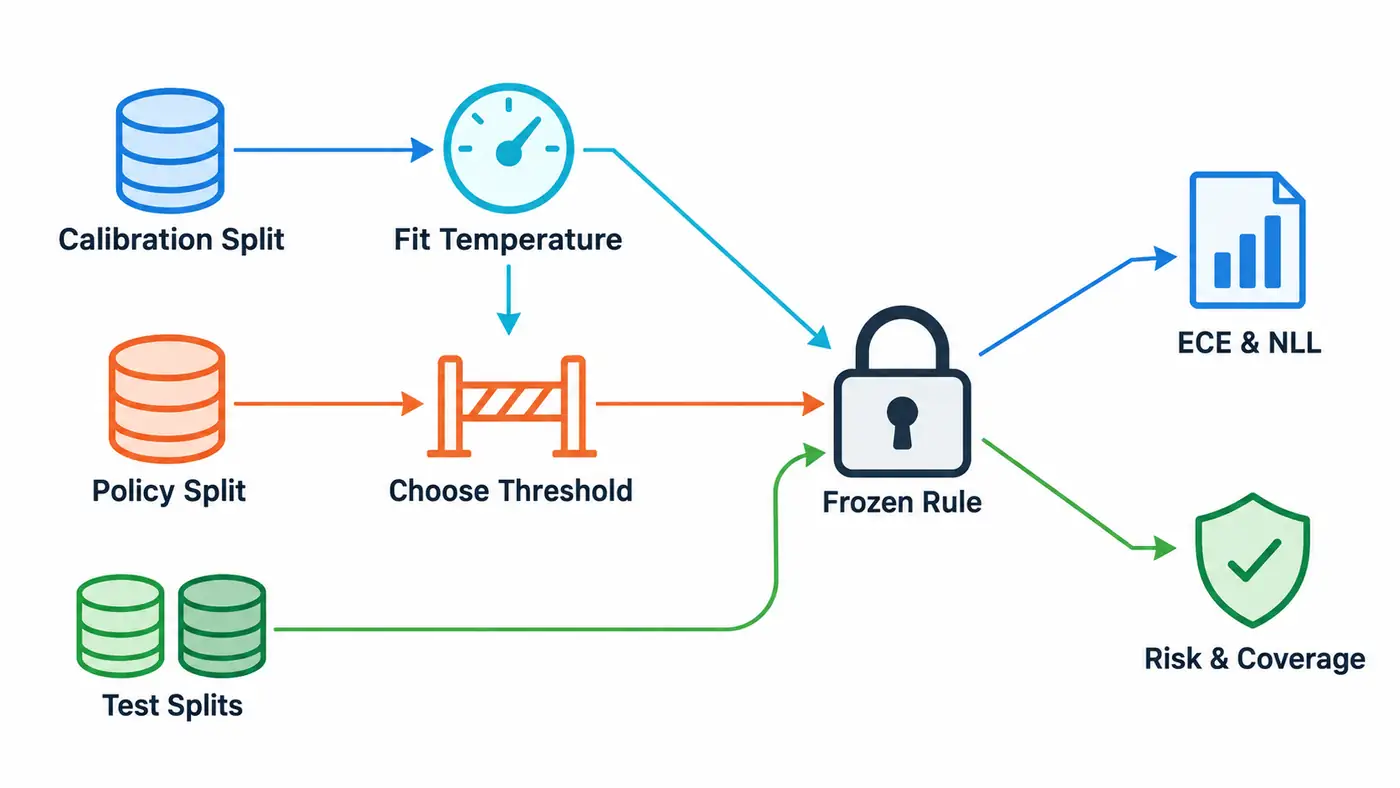
The three data entries in the figure are responsible for fitting temperature, selection threshold and final evaluation, respectively; the test label will not return to the first two steps. The lock indicates that the temperature and threshold have been frozen, and the right side is two different evaluation perspectives, not a guaranteed certification.
This construction three-dimensional standard normal input, so that the linear signal is s=1.5x₁−0.8x₂+0.5x₃. The same distribution label presses sigmoid(s) Sampling, freeze the output of the scorer [0,3s], artificial magnification three times cause excessive self-confidence. Temperature 3 has clear significance under this data mechanism, but the limited calibration sample is estimated to not be exactly equal to three.
The distribution change group keeps the input distribution unchanged, and only changes the label probability to sigmoid(0.5s−1), that is, the distribution of the conditions is changed. It's not randomly messing with labels, nor is it a migration in the realm of natural language. The setting is fixed before viewing the results; the coefficients or torrents are not modified according to the test score.
Each seed generates a Calibration Set, a threshold set of 1,024, and a test set with the same distribution and change distribution. Each set of data is independently generated and checked that the full input line is not duplicated. There is no model training set, because the scoring function is pre-specified, and the only fitting parameter is temperature.
Running in the article directory:
python3 -m pip install -r code/requirements.txt
python3 code/calibration.py
python3 code/audit.py
Dependencies and documentation see How to run the example. The actual environment is Python 3.12.14, NumPy 2.3.5, CPU, double precision. program printing [1024,2] score and [1024] Label shape; the inverse temperature is divided into eighty steps in the fixed positive interval to find the zero point of the NLL derivative, and save the trajectory. If the root is not in the interval, an error will be reported, avoid silent output boundary solution.
5. Evaluation protocol
Fit the temperature first, and then scan the original and calibration scores on the threshold set respectively 0.50…0.99, the step size is 0.01. It is required to accept at least 100 and no more than 10% of the experience risk, and choose the one with the largest coverage rate from the feasible candidates; if there is no solution, all abstention. The 10% here is just a selection condition, not a test risk commitment.
After the two strategies are frozen, the complete Test Set Accuracy, NLL, Brier, five/15/30 boxes of ECE are reported at the same time. For abstention, it not only reports a unified numerical threshold value of 0.9, but also reports the thresholds selected by each, and always pairs the report risk and coverage in pairs. The log holds the number of acceptances, the number of errors and each prediction, avoiding only one beautiful ratio left.
Don't treat the fit loss on the Calibration Set directly as a generalization score. In this paper, the temperature fitting and threshold selection are separated, and the selection deviation caused by the repeated comparison threshold cannot be eliminated; the final result is only read in the independent test set. If the calibration method is added later, the method selection also requires additional verification data or nested division, and the lowest ECE scheme cannot be selected on the current Test Set.
The two classifications are positive temperature scaling keeps the order of absolute logit difference, so the same number of samples is intercepted according to the Confidence ranking, and the accepted collection should be consistent. The program compares the sorting and the whole risk-coverage curve one by one; this check can improve the probability scale and improve the screening ability. This conclusion cannot be applied to multiple classifications.
6. Actual results and explanations
What we tested. The three fitting temperatures are 2.7000, 3.0224, and 3.0529. The following table is the arithmetic mean of the three data seeds. The error term is the standard deviation of the sample between the seeds, not the Confidence interval; see the complete results. Experimental record.
| Test distribution and score | Complete Works Accuracy | NLL | Fifteen boxes of ECE |
|---|---|---|---|
| same distribution, original | 0.7558 | 0.7202 | 0.1451 ± 0.0016 |
| same distribution, calibration | 0.7558 | 0.4958 | 0.0174 ± 0.0058 |
| condition change, original | 0.6363 | 1.3834 | 0.2671 ± 0.0088 |
| condition change, calibration | 0.6363 | 0.7192 | 0.1310 ± 0.0120 |
At a fixed threshold value of 0.9, the same distribution risk fell from 0.1623 to 0.0579, and the coverage rate decreased from 0.6799 to 0.2206 at the same time. After the calibration, there is no more questions that will suddenly be done, but the same numerical threshold has become strict. The actual ordering is exactly the same, and the risk curve coincides with the same coverage.
The independent threshold set yielded calibrated thresholds of 0.85, 0.77 and 0.83. In-distribution test risk averaged 0.0987 at 0.4032 coverage. Seed 79 had a risk of 0.1168, above the 10% criterion used for selection. On the test set with changed conditions, mean risk rose to 0.2769 while coverage remained at 0.4176.
The original score has no feasible threshold in the preset grid of the seed 80, so the policy coverage is zero and the risk is undefined; the threshold closer to one is not searched, and it is impossible to assert that all thresholds have no solution. This difference also reminds us that the same numerical grid does not represent the same candidate acceptance set, and cannot only announce that the calibration improves the sorting based on the grid results.
7. Failure investigation and evidence boundaries
Check the statistical definition first. There are 20 handmade samples: ten confidences are 0.6 and 9 correct answers; the other ten confidences are 0.9 and 6 correct answers. When synthesizing a box, the ECE is about zero, but when it is ten boxes, it is 0.3. The errors in the large boxes cancel each other out, which is enough to show that the results of a single box will hide the problem; this is not the test data of this model.
Check the invariant again. Temperature is a timing answer, and the temperature symbol, category axis, label map or floating point should be checked. Multi-Classification Samples [2,0,0] and [1.5,1.4,-10] The maximum probability of temperature is about 0.787 and 0.525 respectively, and the temperature is about 0.379 and 0.434 at 10 o'clock, and the sequence is reversed across the sample, but the respective prediction categories are not changed.
The final range of evidence is checked. The two scripts are checked through syntax and CPU; the probability of independent scalar audit recalculation, the probability of each box, the threshold selection and the risk curve. During development, the summator tried to average the undefined risk, corrected to preserve the null value, and recorded the number of valid seeds. See verification records for details.
The experimenter knows the probabilities used to generate the labels, but temperature fitting uses only the sampled labels. Keeping the true probabilities out of the fit preserves finite-sample uncertainty. Across the three seeds, both the inputs and labels change. The standard deviation therefore measures variation under repeated sampling from this synthetic process. Stability on a real task remains untested.
This time, there is no official network, real data set, GPU or free text answer evaluation, and there is no Abstation algorithm with confidence upper bound. The large model self-reports "90% certainty", the probability of a token and the entire answer Accuracy are different objects. Before the migration experiment, the prediction unit and correctness label must be fixed.
8. Follow-up scientific research issues
Author’s interpretation. The next step is to keep the model freezing, and switch to the real classification Logits, divide the data according to the source, time or subject group, and check whether the calibration error is concentrated in the small group. It is necessary to keep the sample size in the group to avoid interpreting a small number of errors into a stable law.
These directions also need to distinguish between overall calibration and conditional calibration. Even if the overall score is correct, there may be an offset of one category of overconfidence and another category of lack of self-confidence. You can first report the reliability table of the prediction category or data source grouping, and then discuss whether it needs to be fitted separately; if there are more group parameters, the small sample overfitting must be evaluated synchronously.
In the second step, the empirical threshold selection and statistical risk upper bound on the same candidate acceptance set can be compared, and the feasibility rate, coverage rate and independent test risk are recorded respectively. In the third step, we will study whether the sorting inversion of multi-class sample sorting changes the effect of abstention. Each step changes only one factor to determine that the gain comes from probability calibration, the screening sequence, or the threshold search range.
9. Summary
temperature scaling is a good entry for understanding calibration: few parameters, clear principles, and easy to check. However, ECE, complete set Accuracy, and accept set risk answer different questions. The reusable research products should keep the temperature fitting trajectory, binning count, threshold selection basis, sample prediction and distribution change results at the same time, so that the "score is more reasonable" to become a checkable statement.
References
The following sources are 2026-09-20 The actual retrieval and opening; the repository master is not locked, and the dynamic version is subject to manual verification.
- Chuan Guo, Geoff Pleiss, Yu Sun, Kilian Q. Weinberger. On Calibration of Modern Neural Networks. ICML 2017, PMLR 70:1321–1330. Conference page; Full text. Support calibration definition, temperature targets and binning indicators.
- Author's official Temperature_scaling repository; Core source code. Support maintenance status, logits input, temperature optimization and interval boundary reading.
- Yonatan Geifman, Ran El-Yaniv. Selective Classification for Deep Neural Networks. NIPS 2017. Conference page; Full text. Support the conditions of risk, coverage and the same distribution guarantee.
- Author's official selective_deep_learning repository; risk_control.py. The difference between the upper bounds of empirical errors and the upper bound of the two items is supported.