For graduate students, new research and engineering researchers; search and experiment date: 2026-09-13.

Abstract
Vision-Language Model Answers a chart question incorrectly, the reason may be that the small characters are not read clearly, the color corresponds to the wrong color, and the subtraction is added, or the answer format may not meet the scoring rules. Conversely, a high score does not necessarily mean that the value is accurate. This article focuses on a reproducing goal: first use a known error to calibrate the evaluation protocol, and then design an experiment that can distinguish perception and reasoning. This time, the combined answer test and the official scoring function are run on the CPU, and the actual impact of the relative error denominator, the length of the string and the threshold boundary is verified; there is no image recognition or large-model reasoning.
Contents
- Reproduction value: first determine the measurement object
- Core ideas and formulas
- A guide to the official implementation
- A minimal experiment and its results
- Evaluation Protocol and Data Construction
- Troubleshooting and limits of the evidence
- Questions for further research
- Summary and References
Reproduction value: first determine the measurement object
VLM refers to the model that handles both visual and language input; OCR is the identification of characters in the figure as text. OCR is not guaranteed to answer correctly, because the question may also require matching legends, reading units, or cross-column comparisons. Calling all mistakes "Illusion" will throw away the information that determines the next experiment.
Masry et al. published ChartQA in Findings of ACL 2022. Its tasks involve visual references and logical operations, and its models combine image features with chart data. DocVQA, by Mathew, Karatzas and Jawahar, first appeared as a preprint in 2020. Its third version corresponds to WACV 2021 and emphasizes question answering and structural understanding in document images. The two works illustrate why copying text and interpreting relationships in a chart call for separate evaluation. ChartQA Publishing Page; DocVQA third edition record
This reproduction is the measurement link: whether the same output is still the same judgment after different implementations. Only by using the scorer as the program to be verified can the subsequent model improvement be explained; here we neither reproduce the training of the original paper, nor repeat the performance figures that have not been rerunned.
Core ideas and formulas
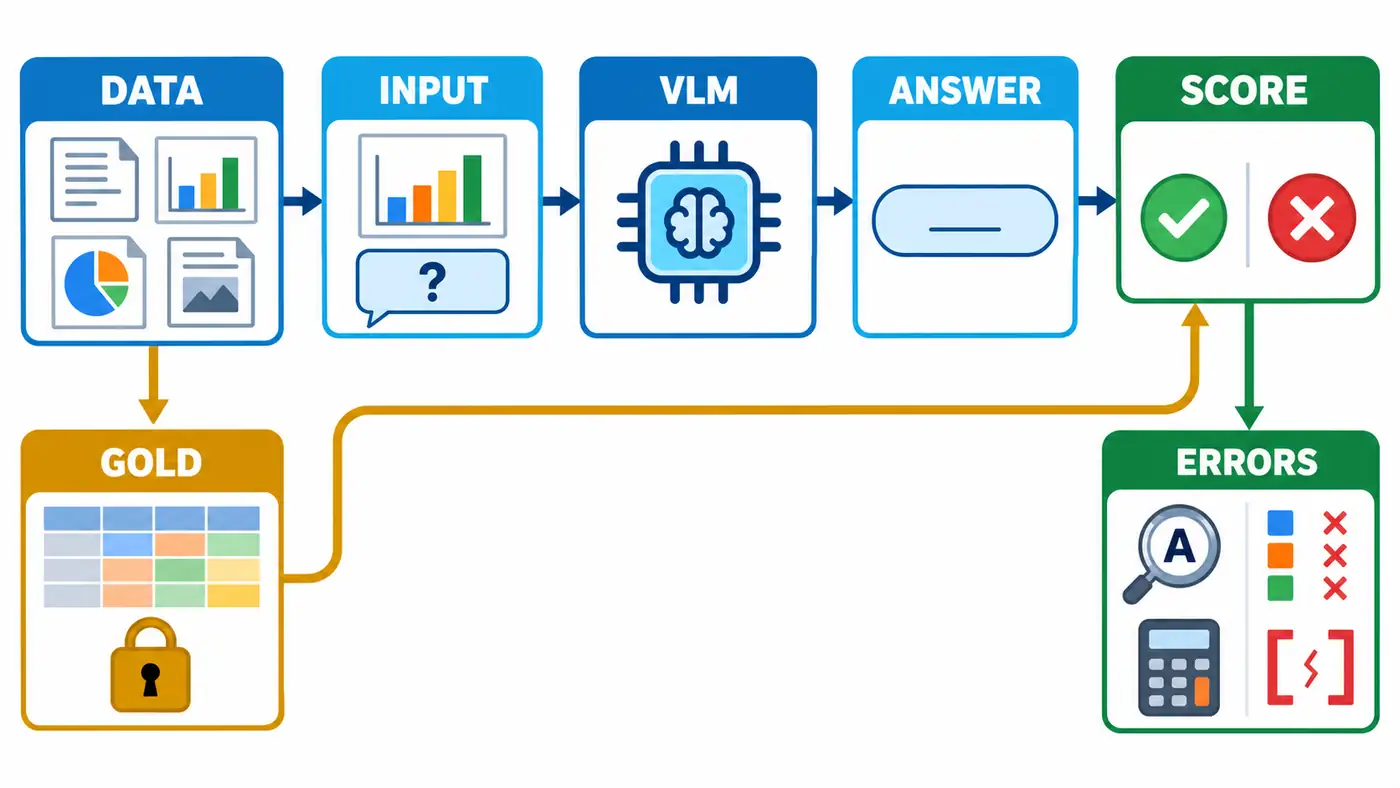
The illustration is the design of the subsequent complete experiment. The model can only receive pictures and questions; the standard answer goes to the score branch. This code only performs calculations between answers, standard answers and scoring, and the model node in the figure has not yet run.
Numerical loose Accuracy allows certain errors. For non-zero standard values can be written as
Among is the standard value, is the predicted value, and the output is zero or one. The fifth section of the ChartQA paper allows a 5% difference between the numerical answers, and the non-numerical answers require precise matching. This indicator tolerates reading deviations, and cannot prove that each number is correct; how to deal with zero values also needs to implement conventions. Section 5 of the original paper
The text side uses normalized editing similarity. Edit distance It is the minimum number of inserts, deletes and substitutions required to change one string to another. Definition of the diagnostic implementation of this article
is the -th question’s set of acceptable answers. Length is measured after applying the same string normalization to each answer. We take the best match across references for each question, then average over questions to obtain ANLS. Empty outputs score zero. The strict boundary matches the distance-threshold formulation in Pix2Struct. Our additional rules for whitespace and empty strings make this a diagnostic score rather than an official submission score. Pix2Struct indicator implementation
A guide to the official implementation
Read first ChartQA repository Data structure: manual and machine generation problems are stored separately, pictures, underlying tables, and location labels are different resources. If the underlying table is put into the prompt, the input conditions are changed; the artificial table is suitable for a separate diagnostic control.
Press again Qwen-VL Evaluation Instructions Find the dataset configuration and run entry. Don't replace the model first, and then guess how the score is calculated. The reading sequence should be the question number, input splicing, generating parameters, answer interception, and index call.
This static check evaluate_vqa.py: relaxed_correctness The first parameter is the standard answer, but the aggregation function puts the model answer first, so that the non-zero value comparison is the denominator according to the predicted value. Another place where the zero value is transferred to a string comparison, resulting in equal values do not necessarily pass. What I'm talking about here is a snapshot of the source code of the day, and it is not possible to assert that all versions are like this.
follow up infographicsvqa_eval.py: Edit the text after the cleanup, but the length comes from the original string, and the result is just half the similarity. This is different from the caliber of this article, and must be compared with a boundary sample. The above source file has been saved and hashed as it is, and the experiment only extracts the scoring function to execute, and does not load the model dependencies; the branch is not locked to the submission number, and the subsequent changes are subject to manual verification.
A minimal experiment and its results
The entrance is minimal_eval.py, dependencies and field descriptions see README. Using the Python 3.12.14 standard library, fix the seed 72, generate twenty document specifications, each contains two values: eight-character identification, cyan and amber. The specifications are structured true values, which are not rendered into pictures, nor are they handed over to the recognition model.
There are four questions for each specification structure: copy the logo, read the cyan value, find the difference between the two, and find the percentage of cyan to the total amount. The first five copies form a development set, and the remaining 15 copies form a test set; the title of the same document is always in the same set. There are 60 questions in the test, including 15 questions in the text and 45 questions for the value. The percentage answer first keeps two decimal places according to the meaning of the question, and then the disturbance action is used for this fixed standard answer.
From the article directory, run:
python3 -m py_compile code/minimal_eval.py code/audit_protocol.py
python3 code/minimal_eval.py
python3 code/audit_protocol.py
The program prints checkpoints, and saves all questions, forecasts, and score-by-question scores and summary. actual output From this run, it is not a sample log. The following uses the diagnostic caliber in this paper; the denominator of each column is different and cannot be combined into a so-called comprehensive accuracy.
| controlled output | Exact match of all questions, sixty questions | Text ANLS, 15 questions | Numerical loose pass, forty-five questions |
|---|---|---|---|
| Copy the standard answer as it is | 1.000 | 1.000 | 1.000 |
| 4% increase in value | 0.250 | 1.000 | 1.000 |
| The value is uniformly increased by 6% | 0.250 | 1.000 | 0.000 |
| Four types of wrong orientation | 0.000 | 0.875 | 0.000 |
| Add all explanatory prefixes | 0.000 | 0.000 | 0.000 |
We injected four kinds of error: substituting the last character of an identifier, reading the other series, adding instead of subtracting, and dropping a percent sign. Every output was constructed, so a perfect score merely confirms that the positive control works. When all numerical answers were increased by 4%, no answer passed the exact numerical check, yet the lenient metric accepted them all. An eight-character identifier with one wrong character still scored 0.875. A high similarity score cannot establish that an identifier is valid.
independent audit Eighty standard answers were reconstructed, 225 numerical scores were reviewed, and two editing distance algorithms were compared with nine hundred and sixty pairs of short strings. Missing, repetition, and additional numbers are rejected, and the rearrangement output does not change the result.
The source code boundary test is also actually passed: when the standard value is 100 and the forecast is 105.2, the denominator is rejected according to the standard value, and the snapshot aggregation function is accepted; the forecast is ninety-five is the opposite. standard string 0 and forecast 0.0 mismatch in snapshots. ANLS independent entrance pair abcd and trailing sixteen spaces abxx give 0.9. Note that the upstream generation script will remove the tail blank first, and this counterexample cannot directly prove that the complete reasoning chain also has the same performance. Complete counterexamples and results
Evaluation Protocol and Data Construction
The real experiment first freezes the data version, document division and answer specification, and then runs the model. Minimum records should include document number, picture check value, question, answer set, unit, evidence location, operation type and original output. The title number must be stable; the cropped version, compressed version and different problems of the same figure cannot be leaked across training and testing.
This specification verifies the truth generation logic of the value, difference value and ratio. When expanding into image testing, the same specification should be changed into different font sizes, resolutions and legend layouts, only one factor is changed at a time; at the same time, the artificially reviewed images do express the values in the specifications. The clear original image and the low-resolution map form paired samples, and should not be regarded as an independent document expansion parent. This part has not yet been implemented, and it will be checked manually.
Set three input conditions: only pictures and problems, external OCR plus pictures, manual correction table plus problems. The third item is a comparison of the correct intermediate information, and cannot be used as an end-to-end score. If the table is still wrong after adding the table, the operation and expression are further checked; if the small-word condition only drops, the difference between crop loss and image preprocessing needs to be excluded.
All conditions are fixed, weight, decoding parameters and output budget. The numerical analysis of this paper only accepts a single limited decimal number and an optional percent sign, allowing 50% and 0.5 The value is equivalent, and the unit will not be deleted or a number will be pulled out from the interpretation paragraph. For real tasks, the answering unit must be specified first, and the unit perception score should be listed separately, and the analysis rules cannot be temporarily changed after seeing the output.
The report preserves the official and diagnostic scoring rules, distinguishes human-written from automatically generated questions, and separates items requiring copying from those requiring computation. Failed requests should remain explicit failures in the denominator. When estimating confidence intervals, resample by document. This experiment uses deterministically constructed counterexamples and includes neither model sampling nor interval estimates.
Troubleshooting and limits of the evidence
First check the input evidence, then check the middle binding and operation, and finally check the output analysis. The corresponding area should be observed for small-character misunderstandings; the color and series of the legend mismatch should be checked; the arithmetic error should save the operands; if the format fails, the original answer and the analysis result should be compared. In the final sentence alone, it is usually impossible to uniquely determine which layer the error occurs.
The author infers that the manual table comparison helps to locate the perceptual bottleneck, but after changing the input, the difficulty of the task is also changed, and the score difference cannot be mechanically interpreted as a pure OCR loss. The reasoning text generated by the model is also not a proof of the internal execution process, and it is best to require recalculated intermediate values and independent evidence.
This fault tag comes from the injection program, not automatically identified from the real prediction. Real fonts, Chinese, curve interpolation, multipage documents, pre-training pollution and video memory overhead have not been verified; the original dataset and weights have not been downloaded. The official complete reasoning, the current dependence on compatibility and the real benchmark score are subject to manual verification.
Questions for further research
The first question is the sensitivity of the scoring caliber: recalculation of different denominators and boundaries on the fixed real output, how many problems are affected, and whether the model ordering changes? The original output must be retained and analyzed according to the document pairing. This paper only proves that there are differences and cannot estimate the universality.
The second problem is where the earnings of the resolution come from: keep the problem with the decoding budget unchanged, and compare the changes of copying questions, color binding questions and calculation questions. If the boost is only focused on character recognition, it should not be generalized as logical reasoning enhancement.
The third question is how to ask for verifiable evidence: let the model give the read series, operands and answers at the same time, and check the evidence accuracy and calculation consistency respectively. The output format itself may increase failure, so it needs to be paired with a baseline that only answers the result, measured gains and additional costs.
Summary
Reading and evaluation is first and foremost a measurement work. Only by clarifying the input conditions, saving the original answer, auditing the scoring boundary, and then failing the failed positioning with controlled intervention can convert a score table into a reliable scientific research problem. This minimum experiment provides an executable protocol check starting point; it does not prove that any VLM has a picture read ability.
References
The following links are actually opened on 2026-09-13. The source code is a floating branch of the same day, and the two Qwen-VL files also have a local hash snapshot; the full-text access of the DocVQA fails, and the title and research scope is supported only using the accessible version pages.
- Ahmed Masry、Do Xuan Long、Jia Qing Tan、Shafiq Joty、Enamul Hoque,2022, ChartQA: A Benchmark for Question Answering about Charts with Visual and Logical Reasoning. publishing page; Full paper.
- Minesh Mathew、Dimosthenis Karatzas、C. V. Jawahar,2020/2021, DocVQA: A Dataset for VQA on Document Images. arXiv third edition record.
- ChartQA author team, Official data and code repository,main.
- Qwen-VL team, Evaluation Instructions、VQA entry、Document Scoreer included in the repository,master.
- Pix2Struct author team, source code of metrics, main, which is used to check the strict distance threshold.