
Date: 2026-08-25
Suitable for readers: graduate students, new scientific research, and hope to make a solid engineering reader for the internal diagnosis of Transformer
Search date: 2026-08-25
Abstract
Attention heatmaps can easily give an illusion that the brighter the color, the token "explains" the model why it is predicted. This statement is only half right. The heat map does show the weights assigned to a certain layer, a certain head to different Key positions after softmax; but it usually cannot prove the causal contribution of the input feature to the final output alone. The goal of this article is not to download a large model to show a beautiful screenshot, but to disassemble the source, shape, visualization protocol and interpretation boundary of the Attention matrix: first use the smallest script to generate a checkable toy Attention, and then compare BERTViz, Hugging Face output formats and explanatory papers, and establish a set of experimental records that "can be read, doubted, and can be reviewed".
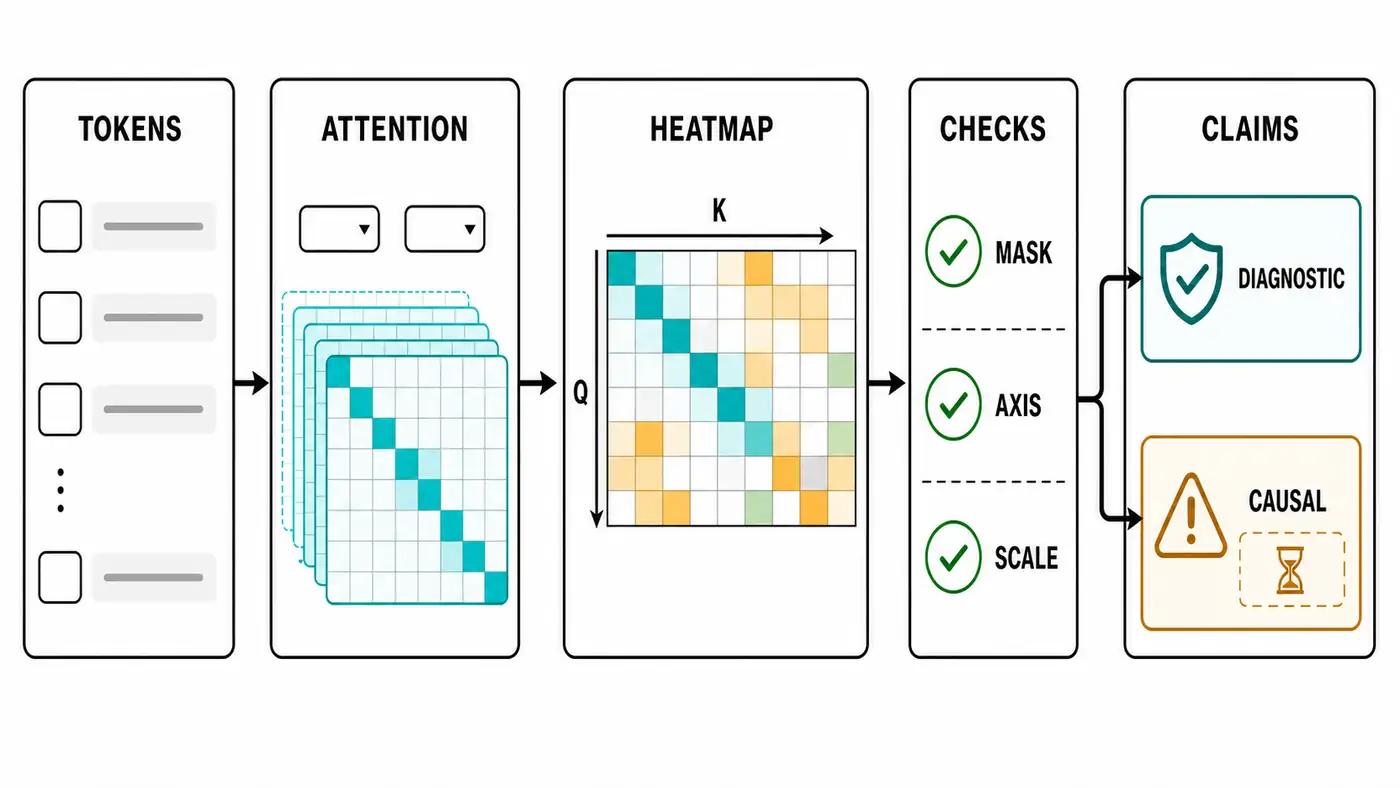
This actual verification is limited by the local environment: torch、numpy、matplotlib Neither is installed, so no real BERT or exported Toy PNG heat map; the standard library shape and mask check of the matching script have passed, and the image export path needs to be manually verified after installation. The official covers and method drawings required for the article have been filled with the built-in ImageGen, and the visual inspection is completed.
Contents
- Why Attention Graphics Worth Reproducing
- What is the heat map
- Minimum code: from Score to Matrices
- How to read the official tool: BERTViz and Transformers
- Interpretation Boundary: Diagnosis is not equal to cause and effect
- Evaluation protocol and troubleshooting
- Questions for further study
- Summary and References
Why Attention Graphics Worth Reproducing
One of the initial attraction of Attention mechanism is that it turns the relationship of "who see who" in the sequence into a probability distribution. Scaled dot-product Attention in Attention is All You Need will normalize the similarity between the Query and All keys, and then use these weights to weight the Value. So the researchers naturally want to draw the weights into a matrix: the row is a Query token, and the column is a Key token. The darker the color, the more the Value of the Query is used.
The reproduction value of this picture lies in debugging, not beautifying the paper. For engineering readers, it can quickly expose three types of questions: whether the mask is written back, whether the padding position is still concerned, and whether some heads are degenerated to only look at themselves or only look at special symbols. For grad students, it is an entry for hypotheses: if a head is always concerned with the delimiter, it may bear the boundary aggregation of the sentence; if a head often looks at adjacent locations, it may approximate local convolution. But these are just testable assumptions, not final explanations.
Here we reproduce the visualization protocol. We make no claim to reproduce the BERT paper’s figures for syntactic heads or to generalize toy results to real language models. A credible reproduction should specify where the matrix was taken from, its shape, and the dimension over which softmax was applied. It should also show whether the colors faithfully represent the values and whether an alternative attribution method or an intervention supports the conclusion.
What is the heat map
The core formula for Transformer self-attention is:
Among Q、K、V are Query, Key, Value respectively; if the size of the batch is B, the sequence length is T, the number of heads is H, each head dimension is D, then QK^T shape is [B,H,T,T]. The last two dimensions are the most important: the first T is the Query location being asked, the second T is the Key location that can be viewed. M It is a mask, usually adding a minimum value that is not visible or padding before softmax.
Thermal drawing is A one layer, a certain head, a sample [T,T] slice. It is not an embedding similarity graph, nor a gradient diagram, nor is it a token importance ranking. because the final output O It also passes through the Value vector, output projection, residual connection, LayerNorm, feed-forward network, and subsequent layers. If a Key gets a high weight, it only means that its Value is mixed in with the current Query position more; whether it promotes the final classification logit, it also depends on the subsequent calculation.
The model output document of Hugging Face Transformers is also attentions Described as a tensor per layer, the shape is [batch_size, num_heads, sequence_length, sequence_length], and states that it is the weighted average weight after attention softmax . This definition is suitable as an interface contract for engineering reproduction experiments: if your visualization tool expects the same layout, you can connect with most Hugging Face models.
Minimum code: from Score to Matrices
The companion script is in code/attention_visualization_toy.py. It does not download the model, nor does it depend on the PyTorch calculation graph, and only uses the standard library to construct a set of tokens, handwritten Q/K vectors, calculate Scaled dot-product score, and [PAD] Columns apply MASK. The default check command is:
python3 code/attention_visualization_toy.py --check-only
The script will print the token list, matrix shape, whether each line softmax is summed as 1, blocked [PAD] Is the maximum probability of the column is 0. This check is more basic than a graph: if the row and not 1, it means there is a problem with the softmax dimension or numerical stability; if the padding column is not 0, the mask semantics may be written inversely; if the shape is not [T,T], which means that the Query/Key dimension has been confusing.
Installation matplotlib A teaching heatmap can then be exported:
python3 -m pip install -r code/requirements.txt
python3 code/attention_visualization_toy.py --out-dir code/outputs --save-png
This picture can only indicate that the drawing pipeline is available, not any real model behavior. When the real reappears, the TOY matrix should be replaced with the model returned by the model outputs.attentions[layer][batch, head], at the same time save the model name, revision, tokenizer version, input text, special token, whether to enable dropout, device and random seeds.
How to read the official tool: BERTViz and Transformers
BERTViz is an open source Transformer Attention visualization tool published by Jesse Vig, corresponding to the ACL 2019 system presentation paper. It provides Head View, Model View and Neuron View: Head View is suitable for single-layer single-headed token alignment, Model View is suitable for overview multi-layer multi-layers, and Neuron View is further tracked. How the specific dimension in the Query and Key vectors contributes attention score. When reading its official repository, you should first look at the data stream of README: load the Hugging Face model, set output_attentions=True, tokenize input, run the model, take out the attention, and then pass the tokens and attention to model_view or head_view.
This route reminds us that the visualization tool is not an "interpreter", but an interactive tensor browser. The BERTViz repository also clearly indicates that the attention weight is not necessarily a predicted explanation; long input or large model will also bring about response speed and visual scale problems. Do not display all layers and all heads at once, but choose a small amount of input, fixed layer headers, save screenshots and original matrices at one time, and then gradually expand the scope.
The Hugging Face documentation provides another key constraint: the model output attentions It is a tuple, one tensor per layer. Different models may have Encoder Attention, Decoder Attention, and Cross Attention; Sentence Pair of tasks also involves Token Type and special symbols. If the token list is not strictly aligned with the matrix axis, the row and column labels of the heat map will be misplaced, and all subsequent explanations will fail.
Interpretation Boundary: Diagnosis is not equal to cause and effect
Jain and Wallace directly challenged the common statement that "Attention is equal to Explanation" in NAACL 2019's "Attention Is Not Explanation". They report that the learned weight is often not related to the importance of gradient class features, and can find very different Attention distributions, but produce similar predictions. This does not mean that the Attention graph is worthless, but shows that the standard Attention weight cannot be automatically upgraded to a causal interpretation.
Clark et al. made a closer look at BERT Attention in BlackboxNLP 2019: some heads will focus on separators, fixed position offsets, or wide distribution, and there are heads It corresponds well to language phenomena such as syntax and co-reference. The key here is "corresponding" and "causing" different. A HEAD looks like a syntactic relationship, indicating that there is a diagnostic pattern within the model; to prove that it is necessary for prediction, it also requires experiments such as masking, permutation, head ablation, counterfactual input or gradient attribution.
Attribution tools such as Captum offer another perspective. They attribute a scalar output to input features. Integrated Gradients, for example, integrates gradients along a path from a baseline to the input. An attention heatmap asks how the module mixes value vectors. Gradient attribution asks how changes to the input affect a particular output. A sound analysis presents the two side by side, since each answers a different question.
Evaluation protocol and troubleshooting
Attention visualization reproduction should record at least six protocols.
| check | Record content | common failures |
|---|---|---|
| Enter | original text, token, special symbols | Tags are misplaced after WordPiece |
| tensor | layer、head、shape | [B,H,T,T] Axis sequentially misread |
| mask | padding or causal rules | True/1 semantic writing |
| Numerical value | row sum, maximum value, entropy | Softmax dimension error |
| Image | colormap, normalization scope | Independent scaling of each picture leads to misreading |
| Conclusion | Diagnosis, inference, and measurement | Treat bright color grids as evidence of cause and effect |
The most common failure is the axis read inverse. Many figures draw the x-axis below and the y-axis on the left by default, but the paper or tool may have different directions for Query and Key. When writing an article, you must be clear that "the row is a Query, the column is a Key", and use a hand-constructed matrix to verify the direction.
The second type of failure is color normalization. If each HEAD is individually normalized to the maximum value, the weak signal may also appear very bright; if all layers are unified, the local structure may not be obvious. It is best to keep the original value in the scientific research report, and explain the color target strategy.
The third type of failure is selective display. Just picking a narrative HEAD picture can easily create a story. A more secure approach is to define the selection rules first, such as fixing the 6th layer and the 3rd header, or reporting multiple samples by entropy, diagonal weights, and special token weights.
The fourth type of failure is to put the model in the training state. Dropout makes the attention weight unstable; the EVAL mode should be cut to the Eval mode before the official visualization, and the version and SEED should be recorded. This script does not run the real model, so the conclusions of these real models are marked as manual verification.
Reproducing the experimental records should also avoid "screenshots, data". It is recommended to keep three materials at the same time: one JSON or CSV original matrix, one PNG with token tags, and a short log to explain the input, model, layer, head, color range and reason for selection. PNG is suitable for reading, the matrix is suitable for review, and the log is suitable for others to know what you drew in a month. If only the notebook output is saved, and later the model weight, tokenizer or dependency version change, it is difficult to judge whether the difference comes from the model behavior or the environment drift.
For the paper report, it is best to divide the conclusion into three grades. The first file is a direct observation, such as "the head is [SEP] The highest weight is assigned. The second file is a statistical description, for example, "In 200 samples, the separator of the HEAD has a higher average attention." The third file is an interpretive inference, such as "the HEAD It is possible to assume the function of sentence boundary aggregation.” Only the third file needs to be extra cautious, preferably with ablation or alternative attribution method; otherwise the reader will misread a visualization phenomenon as a mechanism proof.
Questions for further study
- For the same input, how high is the order consistency of attention weights, Integrated Gradients, Occlusion and Head ABration?
- Which HEAD patterns are stable across samples, and which only seem explanatory in the case diagram?
- Is the output change significantly larger than the masking low weight connection if the maximum weight connection is masked?
- In the long context model, can attention visualization help to diagnose lost-in-the-middle, or will it be limited by sparse and efficient attention backend?
- Can the Cross Attention diagram of the Multimodal model correspond to the image area evidence, or does it need to be intervened by experimental verification?
What these issues have in common is: first turn visualization into reproducible measurements, and then discuss explanations. Heat maps are research entrances, not conclusions themselves.
Summary
Attention heatmap is best suited to take on three things: checking the implementation, discovering patterns, and generating hypotheses. It can tell us how to assign weights to a certain head of a certain layer, and can also help locate the Mask, Token alignment and special symbol dependency issues. But it can't answer "Why the model predicts this category" separately. From the perspective of reproduction, the most important thing is not to draw a beautiful matrix, but to save the original Attention, clarify the Query/Key direction, and fix the visualization protocol, and separate the paper report, this actual verification and the author's inference.
The smallest script in this article has completed the standard library Smoke Test; the official drawing has been completed and passed the inspection. In the next step, if you want to expand into a real model reproduction experiment, you should run the Toy HeatMap export command after installing the dependencies, and then connect to the Hugging Face model. output_attentions=True output, save the original matrix, PNG and protocol logs.
References
Search date: 2026-08-25. The following links are preferred to use the paper page, official repository or official document; dynamic documents and repository content may be updated, and the official experiment should record the visit date, model revision and local dependency version.
- Ashish Vaswani et al., Attention Is All You Need, arXiv 2017, the current arXiv page shows that v7 is revised on 2023-08-02.
- Sarthak Jain and Byron C. Wallace, Attention is not Explanation, NAACL 2019.
- Kevin Clark et al., What Does BERT Look at? An Analysis of BERT’s Attention, BlackboxNLP 2019.
- Jesse Vig, A Multiscale Visualization of Attention in the Transformer Model, ACL System Demonstrations 2019.
- Jesse Vig, BERTViz official repository, attention, visualization tools and examples.
- Hugging Face, Transformers model outputs documentation,
attentionsOutput format description. - Captum, Model Interpretability for PyTorch API, gradient, disturbance and layer attribution method index.