Date: 2026-11-07
Summary: Before looking at the fitted drawing, first find the point that did not participate in the fitting
Suppose you want to choose a budget for the next language model training. There are two reports on the table: one draws a well-fitting curve with all the training results; the other covers the most expensive training times, only uses cheap experiments to make predictions, and then reveals the answer. What you have to decide is how to spend the next computing power, and the second report is closer to your problem. But if the next time you have to change the corpus, the second report will only answer half of it: it tests the cross-budget, but does not necessarily test the cross corpus.
The Scaling Law writes the relationship between the training resource and an observable result as an empirical formula. "How far can be predicted" does not deviate from a unified multiple of indicators and training conditions. The boundary of the evidence is the configuration that has not been used in fitting, and later used to test the configuration, and the actual errors in these configurations. The following three studies reveal a different trump card: which model is the most cost-effective, whether the same amount of data is equivalent, and whether the smaller model can predict the answer score of the larger model. This article only checks the original paper and does not report new training experiments.
Recognize the amount of both ends of the curve first
The pre-training loss gauge model is assigned a good probability of the real next tokens. Tokens is the text unit cut out by Tokenizer; even if the model does not put the correct tokens first, giving it more probability can reduce losses. Answering accuracy has different ways of bookkeeping: a question has changed from hesitantly to almost answer correctly, as long as you choose the wrong one at the end, the score will not move. There is also a third quantity: given the computing power, which parameter scale has the lowest loss? It's the bottom of the valley Where is it, not the bottom How deep. The same sentence "We predicted performance", in these three cases, three different acceptance answers are required.
Estimate an intermediate point between the existing maximum and minimum budget, called interpolation; beyond the already seen budget to predict greater training is extrapolation along the budget axis. The test text does not appear in the training corpus, which does not mean that the model size has not participated in curve fitting. In turn, the maximum scale is left, and it does not mean that the new field is tested. When reading a paper, you might as well write two lines in the margins: What did you not see during the model training? What did the researchers not see when choosing formulas and estimating coefficients? The two lines are written different objects, and they cannot be replaced by just one "leave".
The first card: Does the small model really cost the same amount of computing power?
Polian et al., Figures 1 and 2 Reduce the problem to a choice: under the same training computing power, do you make it bigger, read less, or do it smaller and read more? They train a group of decoded language models from small to large, and compare the losses along the same calculation budget. At the bottom of each budget estimate, these positions are finally connected into a law. The starting point here is to model different sizes under the same type of training formula, not to continuously add parameters to a ready-made model.
The difference is in the compute accounting. Turning the last layer’s representation into scores over the whole vocabulary costs compute too, and that cost is larger relative to the other layers in a small model. Leave it out and the same position on the horizontal axis may represent different spending. Warmup matters too: the learning rate rises gradually at the start of training. Give every model the same warmup length and some low-budget runs will still be warming up at the comparison point. Treating their loss as typical of ordinary training would fold differences in training schedule into the scaling law. Figure 1a–c, Figure 2
The authors change these settings item by item, and then adjust the optimizer according to the scale, and the optimal scale trend obtained under their training conditions is closer to the conclusion of Hoffmann and so on. A very important detail is that the learning rate attenuation for each budget is arranged, and there is no tendency to change the optimal scale; this is not contradictory to the reduction of losses. The loss of the entire row of candidate models can be reduced together, and the most economical option is still nearby. Supplementary Analysis of Figure 1C–E and Section 1 Therefore, this work supports a verifiable difference interpretation. It does not prove that the architecture, vocabulary or optimizer should be copied in the future, and all should copy the same parameter distribution curve.
The second card: the same number of tokens, what is the model fed to the model?
Subramanyam et al., Section 5 Turn the data quality into a toggle knob. They took the English-German translation samples from the parallel corpus, and the next tokens predicted samples were drawn from the English web corpus to change the ratio of the data volume and the disturbed sample respectively. The translation task covers a part of the selected sample tokens with a filler; the language modeling takes other tokens from the vocabulary to replace it. The experimenter knows which samples passively over the hands and feet, so that the degree of pollution can be compared at the same scale. The "quality" here has a reproducible definition of operation, and there is no need to rate the article on the basis of impressions.
In the measured range, increasing the amount of data and increasing the proportion of samples that are not disturbed is accompanied by a decrease in the test loss. The authors describe this change in a formula with a mass term and list the coefficients estimated on the unseen data. Please note Figure 1 and Table 3 The division of labor: the picture is the loss under the control conditions, and the table compares the estimated parameters on different data. The coefficient is similar, and it is not a claim of the same intensity that "locking the old coefficient can report the absolute loss of the new corpus". The latter will need to hand over unrecalibrated predictions and errors.
Why is this difference useful for readers? If a training plan includes "adding a new batch of professional documents" into the budget according to "read more of the same distribution text", it has made hypotheses beyond the research design. Replacing tokens at random can destroy local language cues; introducing clean articles in another field may preserve syntax, but change the distribution of terms and topics. The manipulation of the original paper is not enough to mark the same discount rate for these two things. For a batch of new corpus, first explaining which test text and which task is so-called "higher quality" is more useful than giving it a seemingly accurate coefficient.
The third card: cover the more expensive training, can you guess the score of the answer?
Krajewski et al., sect. 3, formula 2–3 Providing evidence that is closer to this topic. In the setting of each parameter corresponding to twenty training tokens, they directly use the training computing power to predict the scores of each task: the fit is the amount after the accuracy takes the negative logarithm, and each benchmark has its own coefficient. For multiple-choice questions, guessing is possible, and the author also estimates a random baseline and normalizes accordingly. This process determines the meaning of the bottom of the curve; you cannot take a small model of the original fraction close to the guessing level and directly stuff it into the formula fitted for the correction after correction.
The author is lower than The training of sub-floating-point operations is used to estimate the coefficients, and the rest of the training is left for verification. Table 1 The absolute error of the cross-indicator average is given: the fitting part is 0.0086, and the reserved part is 0.0195. The comparison here is The error of the same prediction method on the training configuration of the two groups. The latter number is not the upper limit of error for each task, nor is it the ratio of the model to answer the wrong question. Its value is that the prediction is more close to the real usage than the random mixed-size model, rather than a few decimal places.
If the number of tokens is also released by reading each parameter, the author will use the formula containing both parameters and data amount, and also draw a configuration with a high budget or high tokens parameter ratio. Section 3.3, Table 2 For the researchers, this change is more useful than copying a certain average: no matter how far the fixed ratio has been, it has not walked out of the matching line. To predict the points outside the line, you must explain how the extra direction enters the model, and test it with observations in that direction. The reserved conditions and fitting styles of the two tables have changed, and it is not advisable to interpret their error values as the net benefits brought by changing the formula.
Look at the residuals: Does the law continue, or does it just look like it in a small area?
Residuals are actual value depreciation values, which are retained and negative signs. The two curves can almost overlap at a few cheap points, and when the bigger budget starts to flatten and the other continues to rise. If you only look at the average and absolute error of all points, you can't see whether the high budget end is always underestimated, and you can't see which task is hindering. When checking, it is best to arrange the largest gears in the order of budget, and ask each task separately: Whether the error has always been the same number, and whether the error size has been large enough to change the resource selection? A deviation may come from the model form or from the sampling fluctuation of the limited problem, don't rush to name a point as "turning".
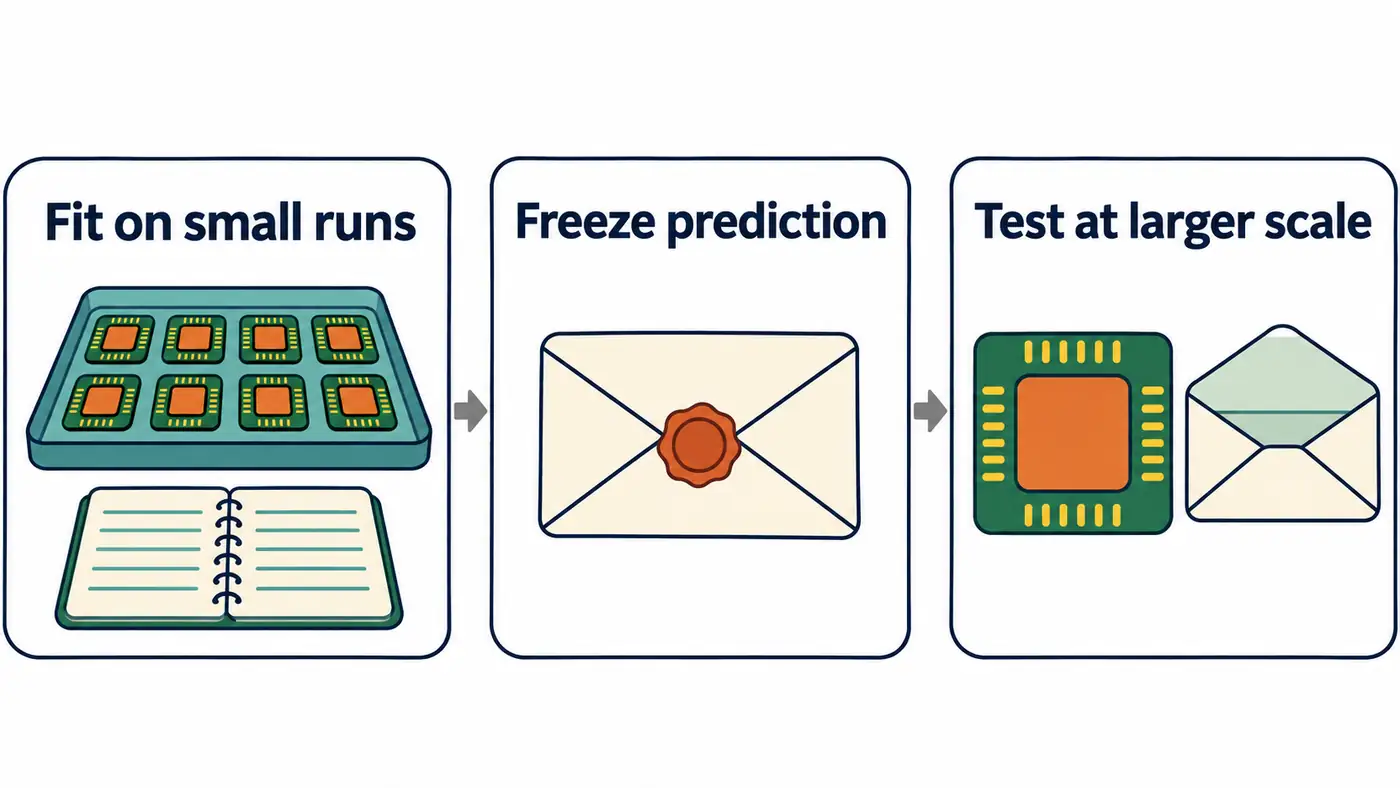
Figure: The test sequence recommended for subsequent research. The arrows indicate successive, not that the paper has found a causal mechanism; there is no measurement data in the figure.
Two explanations can be distinguished by a design that does not have to be re-trained from scratch: one is that the same training formula does allow the small budget to predict the big budget; Select the training records of the same family that are open and traceable, and first set a goal task, a scoring method and a maximum number of budget files. under these gears The whole training and its checkpoints To be isolated together, we cannot leave the early results of the large-model training in the fitting table, which is also said to have never seen this training. The same batch of questions and the same reasoning and sampling budget are used for all models, so that the training scale will not change, and the examination opportunities will also change.
Use only the remaining records to compare two prespecified methods: carry forward the measured score from the last small budget, or fit a scaling curve to the small-budget runs. Freeze the data filters, function, and predictions, then reveal the held-out runs and report signed and absolute errors at each budget. Set the tolerance in advance according to the score error the task can accommodate. If the curve misses that tolerance at the largest budget or is no more accurate overall than carrying the score forward, stop recommending the formula for larger budgets. If the predictions are indistinguishable within measurement error, the available budget cannot separate them. If the public data already helped select the formula, call this a retrospective check and save the blind prediction for the next round of training.
One more batch The budget is equivalent but the corpus ratio is different The record, as another test: accurate prediction of the same formula, and the deviation after the corpus is changed continues in the same direction, indicating that the original available rules need to be recalibrated, but it is not yet possible to specify which type of text is caused. If the scale and the corpus are always changed together, the existing records cannot be dismantled in these two explanations; the stop point of honesty is that the report lacks cross-configuration. This design was not performed in this article, nor did it borrow undisclosed test sets from other experiments.
Summary: Write valid conditions for forecasts
Read the three papers together, and pay attention to what each one predicts. The first estimates the optimal model size and shows how accounting for compute can change the optimum. The second studies loss under controlled contamination and reminds us that tokens needn’t carry equal amounts of information. Only the third tests predictions directly against question-answering scores at larger budgets. Next time you see an elegant scaling curve, ask the authors to finish this thought: Which smaller runs did I use to predict which larger run held out of the fit, and by how much did my prediction miss on which metric? If it can be completed, there is an extrapolated distance that can be referenced; beyond that, it is still an assumption that is worthy of bets and may be wrong.
References
- Porian et al. (NeurIPS 2024), Resolving Discrepancies in Compute-Optimal Scaling of Language Models.
- Subramanyam、Chen、Grossman(ICLR 2026), Scaling Laws Revisited: Modeling the Role of Data Quality in Language Model Pretraining.
- Krajewski et al. (ICLR 2026), Revisiting the Scaling Properties of Downstream Metrics in Large Language Model Training.
Apps by the author
I also build small tools for everyday life. Here are two of my apps:
- Daily Expense Journal: Track your income and spending, plan a budget and set savings goals. View on the App Store.
- One Small Action: Pick a small action that fits the time and energy you have today, then record how it felt and what you noticed. View on the App Store.
Find more articles and projects on my website: zffjzz.top. I’d love to hear how the apps work for you and what I could improve.