AI Frontier Observation · Interpretation Date November 14, 2026 · Information Deadline 20:33:01
How much coffee did everyone drink at an academic conference? A language model’s estimate might be off by an order of magnitude. How much accuracy can we recover by asking the same model to estimate independently thirty times and combining the answers? In a preprint submitted on November 12, Carolina Fortuna and Blaž Bertalanič of Slovenia’s Jožef Stefan Institute report results on a set of Fermi estimation questions. They calculated the error reduction for each model separately. The median reduction for thirty answers versus one was 1.7%. To understand why, look at the value around which the estimates fluctuate. preprint record
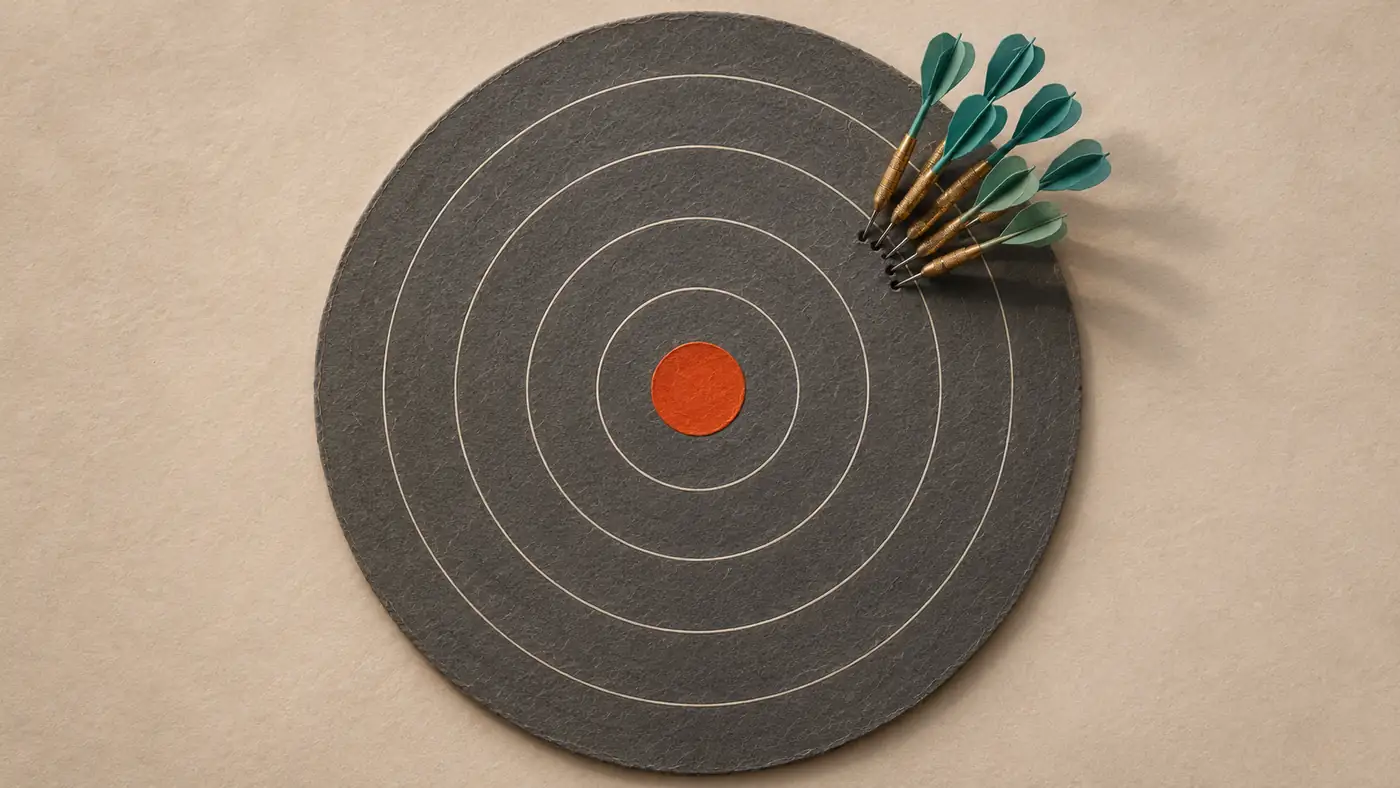
Schematic of original concept. The number and landing point of darts do not correspond to experimental data.
A coffee question can be wrong in two places
Conference Coffee is the example in the title of the original paper of realFP's title. Fermi estimates allow the number of direct inventory to be disassembled. For example, first estimate how many people are present every day, how many of them drink coffee, each person drinks a few cups a day, and then take the meeting period. Even if no one knows the exact number of cups, the reader can check what facts are used one by one. The original dataset provides a problem-solving step for the problem to support facts and executable. Paper paper|Data Warehouse Description
It is assumed that the daily average cup number given by the model is slightly different, sometimes the guess is high, and sometimes the guess is low. Ask a few more times, this part of the fluctuation has the opportunity to offset. However, if you regard the cumulative number of people present every day as the number of people present every day, and take the session period again, the answers can be different, but all of them are too large. Observe the answers a few cups from each other, and you can't find the problem of repeated counting. This hypothesis example illustrates two types of errors, and does not specify the specific wrong cause of the model in a certain real question.
Leave the answers to the same question together
Of realFP’s 557 test questions, the authors selected the 529 with positive, finite reference values. They analyzed roughly 2.51 million answers from 15 open-weight models, all given before any exchange of information. Members of each same-model group received the same prompt and answered separately. The researchers combined estimates using the geometric mean, appropriate when estimates span orders of magnitude. If the reference is 100, for instance, 10 and 1000 are each off by a factor of ten. They sit equally far below and above the reference on a log scale, and their geometric mean is 100. Paper method and table 1
The researchers first calculated how much it is overestimated or underestimated for each model, and then sees how much the output deviates from the average level of the question. In the main experiment, the proportion of the previous one with the change in the total error variance was the proportion of the total error variance, and the median of the cross model was 90.6%. The denominator is the variance of the error. If you only take one question, the two independent answers can have their own fluctuations. Explanation of the entire question set, which questions are often overestimated and on which questions, but there are quite stable rules. Paper table 2
What happens when the error direction is disrupted?
The author constructs two 30-member groups that can be compared. The first is to independently sample the existing answers of the same question from the same model, and the answer is put back every time it is drawn. This preserves the original overestimation or underestimation tendency of this question. The drawn group is almost the same as the actual group. This explains a phenomenon that is easily misjudged: even if there is no communication between members, independent sampling is enough to generate a set of answers that are crowded near the wrong location. Section 5 of paper
The second type still retains the magnitude of each error, but randomly specifies the positive and negative directions of the error. A question that was always overestimated, now has the same opportunity to be underestimated. After this step, the error of the merged thirty answers was 74% to 79% less than that of the single answer, and the median decline of the actual group was only 1.7%. The two sides use the same indicators that are scored by magnitude and limit the impact of extreme errors. The random flip direction needs to know the reference value first, so this group of results can only tell us how much effect it can play on average after eliminating the problem-by-question bias. Paper Table 2 and control design
When the five answers are getting closer
Let the members see each other's answers, and there is another layer of questions. In the five-member group, from the first round of response to the third round of revisions, the indicators used by the authors to measure the differences in the group fell by 93%. For 12 of these models, at least half of the questions have given the same number. However, on the same batch of questions, the variance of the model-to-question average error is almost inactive. For readers, if the interface only shows the five estimates of the last round, what is missing is exactly the most important message: how far is the consistent answer to the reference value. Section 6 of paper
This paragraph also has a program error that affects the interpretation. The program responsible for putting teammates' answers into the next round will sometimes miss the scientific notation. The author can re-score the original text, but cannot let the members who have completed the revision forget the errors it sees. After excluding the affected group, the main results of the same model group are similar, and the debate effect of mixed groups of different models needs to be re-run to judge. In the first round, the members have not seen the answers of their teammates, and the previous thirty independent estimates did not go through this step. Section 6 and Limitations of the Paper
Where should the computing power be spent in the next round?
Back to the coffee problem, it is worth comparing two usages. One group continues to estimate independently, and the other group spends part of the budget to verify a large amount, such as the actual number of people present every day. Let the two groups of similar reasoning and retrieval costs, and then see whether the furthest questions are closer to the reference value. You can also keep the number used in each step, so that the improvement comes from the fact that the missing fact is found, or there are just two errors that just cancel each other out. Only such an experiment can answer, supplement information for a specific estimated question, whether it is worth the budget it occupies.
This study shuts down the thinking mode of the model, and the main experiment generates up to 1024 tokens each time. Both data and extended reasoning are still the paths to be tested. As far as these models and questions are concerned, thirty answers are enough to estimate the position of the answer to a more stable position; to judge whether this position is credible, one has to find a basis for independent these thirty answers. Discussion and limitations of paper
References
- Preprints and version records of Fortuna and Bertalanič
- Full text, methods, forms and limitations of the same preprint
- Kalyan et al. original paper on Fermi, EMNLP 2021
- AllenAi/Fermi Question Set Repository Instructions
Apps by the author
I also build small tools for everyday life. Here are two of my apps:
- Daily Expense Journal: Track your income and spending, plan a budget and set savings goals. View on the App Store.
- One Small Action: Pick a small action that fits the time and energy you have today, then record how it felt and what you noticed. View on the App Store.
Find more articles and projects on my website: zffjzz.top. I’d love to hear how the apps work for you and what I could improve.