
- Date: 2026-09-22
- For graduate students, early-career researchers and research engineers
- Reproduction Scope: Replay Adversarial Robustness: If the attack is not successful, is the model robust? 》 synthetic experimental abstract, verification log, statistical table and matching interval; do not retrain the model.
Abstract
"Averaging two points" is not a complete experimental conclusion. Which runs do the two points come from? Do you use the same test set ? Does the error bar indicate fluctuation between seeds, or is the mean value uncertainty? Has the failed operation been quietly deleted? This article organizes a report around an executable target: given the saved experimental log, it automatically generates tables with clear statistical meaning, and allows each number to be traced back to counting, protocols, and source files. We reproduce the reporting process and do not claim to reproduce the performance of reinforcement learning papers.
Contents
- Reproducing value and paper problems
- Core Ideas and Statistical Formulas
- A guide to the official implementation
- Minimum Experiment and Log Contract
- Evaluation protocol and results
- Error bars, failure checking and verification records
- Reusable report template
- Follow-up research questions and summary
The problem of reproducing value and paper
What the paper reports. Agarwal, Schwarzer, Castro, Courville and Bellemare in NeurIPS 2021 Discusses the reinforcement learning evaluation under a small amount of operation: only comparing point estimates such as mean or median will hide the uncertainty caused by limited samples. This paper proposes tools such as interval estimation, performance distribution and quartile truncation mean, and publishes RLIABLE. [1]
The interquartile mean (IQM) is a robust summary statistic computed by sorting the scores and averaging the middle half. It can help show how outlying tasks affect an aggregate score. It cannot fix test leakage, an incorrect denominator, or selection of the best seed. This experiment has one synthetic task. Its five perturbation budgets do not count as five independent tasks for computing an IQM.
What we tested. Enter from "Adversarial Robustness: If the attack is not successful, is the model robust? 》The existing three models run, each run contains five disturbance budgets and four attacks, a total of sixty abstracts. The goal is to restore the mean and sample standard deviations of twenty condition groups, and check the pairing difference between weak attacks and strong attacks. The performance of the model follows the old log, and the new evidence is the reporter calculation and audit results.
2. Core ideas and statistical formulas
Define the estimation object before the report: we care about how the robust accuracy obtained by a certain attack changes under the same synthetic generation mechanism under the same synthetic generation mechanism. The robust accuracy is described as RA, and the denominator in this case contains all the test samples; the samples that were originally classified incorrectly are also included in failure.
Among them, the seed index is (S), the disturbance budget is (E), the attack method is (A), (N_s=2048) is the number of test samples, (F) is the number of failures, (S=3). Summarized tensor shape is [3,5,4]: Three runs, five budgets, four attacks. These sixty grids cannot be directly regarded as sixty independent repetitions.
SD is the sample standard deviation, which describes the observed fluctuation between runs; SE is the mean standard error, and the uncertainty of the estimated mean value under the assumption of independent and same distribution operation. (r_s) fixed budget and method in the above formula. The two units are the same and have different meanings. Neither of them can be directly renamed "95% confidence interval". The NeurIPS checklist requires a clear source of variation, calculation method, and type of error line. [2]
When comparing the two attacks, first calculate (d_s=r_{s,a}-r_{s,b}), and then estimate the interval for (ar d=s^{-1}\sum_s d_s). Here, each pair of results shares the model, test samples and budget; the seed name of the same number itself is not enough to prove that other projects also have such matching conditions.
3. Guide to the official implementation
Read the input convention of RLIABLE README first: it is usually a matrix of "number of runs × tasks", and see how the indicator function consumes it. [3] Continue reading metrics.py: aggregate_mean First find the running mean of each task and then find the task mean, aggregate_median Take the median of the mean of these tasks, aggregate_iqm Use the truncated operation. [4] The focus of reading is axis and weight, not just function names.
Then again library.py of get_interval_estimates. Array input goes StratifiedBootstrap, the default is not to resample the task; this corresponds to the estimation problem of fixed task collection and redo operation. Most array inputs go StratifiedIndependentBootstrap, extract the input samples separately, and cannot directly use it to assume that the inter-method pairing is preserved. [5]
Final control SciPy bootstrap Documentation: paired=True Only the sampling index will be shared. The default interval method is BCa; the default RLIABLE entry is percentile, that is, the percentile method. [6] The script in this article does not call these libraries, but explicitly enumerates three pairs of pairs of resampling to avoid confusing different default values.
This reading is the official repository of the search day master, not pinned commit; the source code reading has been completed, and the official library operation and version compatibility are subject to manual verification. The standard library run record of this article cannot be written as a reproducing record of RLIABLE.
4. Minimum Experiment and Log Contract
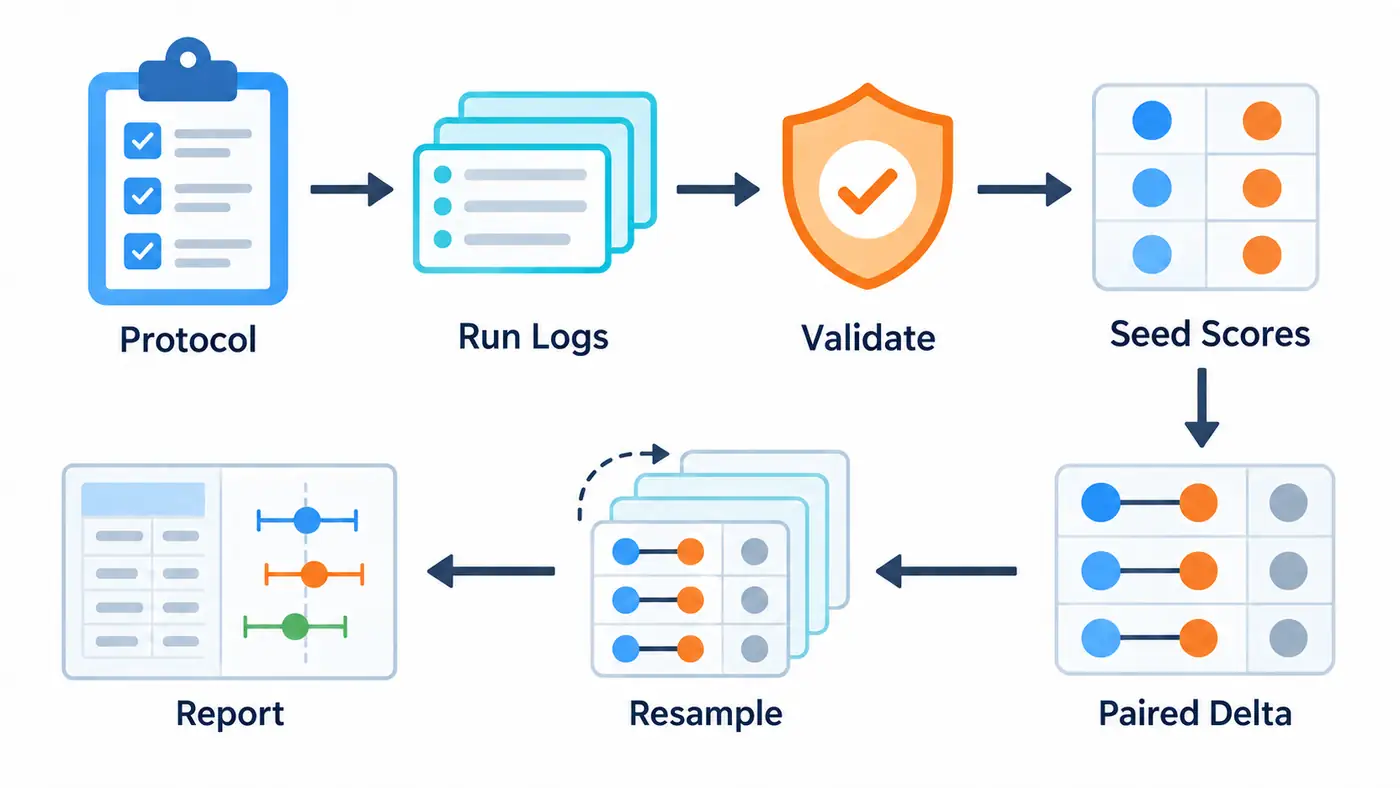
In the figure, the logs are checked first, then the seed fraction is formed, the pairing difference is calculated and resampled. The icon and the error line only show the data relationship and do not carry the numerical results; the report end cannot feedback the experimental configuration of "Better Look".
Execute from this directory:
python3 code/report.py
python3 code/audit.py
PYTHONPYCACHEPREFIX=/tmp/080-pycache python3 -m py_compile code/report.py code/audit.py
Only the Python standard library is required, no model download or acceleration card is required. Input and dependency instructions see code/README.md. input/source_summary.json is a byte copy of the original abstract; manifest.json Record source hashes and protocols; runs.jsonl Organize nested results into one condition per line.
Each row retains the run identity, method, budget, data division, metrics, number of samples, number of failures, status and protocol hashing. The script checks whether the schedule grid is complete, and verify that the score can be restored by the failure count. Hash can only find the content changes, but cannot prove that the upstream experiment is correct; upstream predicted audit belongs to "Adversarial Robustness: if the attack is not successful, is the model robust? the scope of evidence.
The original experiment uses three different seeds to generate training, verification, test data and initialization at the same time, ordinary logistic regression training is a thousand steps, and the final checkpoint is obtained. The Validation Set is only used for recording. Therefore, the SD of this article mixes operational changes such as data sampling and initialization, which cannot be interpreted as "pure initialization variance". The four attacks share the data and weights of each run; the zero gradient diagnostic example has been excluded according to the clear rules.
5. Evaluation protocol and actual results
All budgets are reserved for 0、0.05、0.1、0.2、0.3, text presentation 0.2, the complete table is saved in results/table.csv. This is a teaching playback based on known results, and cannot claim pre-registration or independent confirmation experiments. Both the method and display conditions are disclosed in the description, and no new checkpoint is selected with the test score.
What we tested. The following values are recalculated by the saved counts. The unit of mean value in the table is percentages, the SD unit is percentage points, and the three operating weights are equal; the two columns are not "confidence interval of the mean".
| attack setting | runs | RA Mean (%) | Running SD (percentage point) |
|---|---|---|---|
| 16 random searches | 3 | 97.998 | 0.169 |
| Weak PGD, 2 steps | 3 | 99.105 | 0.149 |
| FGSM, single step | 3 | 76.969 | 1.237 |
| PGD, 20 steps, 3 restarts | 3 | 76.969 | 1.237 |
PGD is a projection gradient attack, and FGSM is a fast gradient symbol attack. Compare the attack evaluator here, higher RA may indicate that the attack has failed, and it does not mean that the model has become stronger. The two strong attacks are the result of this linear model and threat setting, and cannot be generalized as the equivalence of any neural network.
The three pairing differences of weak PGD strengthening PGD are respectively 20.898、22.461、23.047 percentage points, the mean value is 22.135. The script is exhausted and extracted all the three runs with equal probability sequences (3^3=27); the two ends are taken according to the inverse empirical distribution function, and the nominal 95% fractional interval is obtained. [20.898,23.047] a percentage point. Fixed random seeds 80 10,000 samples are also kept in the verification record.
Exact enumeration removes sampling error from this empirical resampling distribution. It gives no guarantee of exact interval coverage and adds no experimental runs. Three original runs are still very few, and the paper itself shows the risk of undercoverage with few runs. [1] We therefore draw no conclusion about a statistically significant winner.
6. Error bars, failure investigation and verification records
If you want to draw the official result map, each seed should be drawn into scattered points, and then the clearly defined interval should be superimposed; Draw the difference interval on the pairing difference, instead of judging the difference by whether the error bars of the two single method overlap. The decorative symbols in the method diagram cannot be used as a reference to the data graph.
For example, the same model measures Accuracy on two thousand samples. Increasing the test sample can reduce some sampling noise, but does not generate a second model training out of thin air. On the contrary, if the two methods each change a test set, the difference in the score is also mixed into the difficulty of the question. Statistical units must correspond to research questions, and the code to run does not mean that the selected unit is reasonable.
First, check the identity problem: the append log may repeat the same operation, and the sorting change may mismatch two methods. The script uses explicit key alignment, and the results remain unchanged after out of order. Secondly, check the failure record: the unfinished, empty value, and non-limited value cannot be filled with zeros and continue to be averaged, and cannot be removed silently; this example will stop aggregation, and it is required to explain the reason for the missing first.
Check the statistical hierarchy again: the test samples, checkpoints, and attack budgets under the same model are relevant. The resampled test sample can answer the change of the fixed model under the sample sampling, but cannot replace the variance of retraining. If the data comes from the same patient, document or dialogue, it should also consider resampling by group, and cannot mechanically copy the sample by line.
This time, the syntax check and Smoke test are completed on Python 3.9.6 and CPU. Nine types of error logs are rejected; constant pairing differences, the same method and log out of sequence are checked. The independent audit script does not use the reporter function, and repeats 60 records of 60 records, 20 sets of statistics and 27 resamplings. 1e-14. Proof-by-sample prediction playback, retraining and interval coverage experiments were not run, and were manually verified.
7. Reusable report template
accessary REPORT_TEMPLATE.md The report is divided into six parts: research questions, running protocols, evidence index, results, failure and boundary. Each result table should be able to answer three questions: what are the conditions for comparison, what are the statistical units, and where to regenerate from.
The conclusion in the template should use the sentence pattern of "how much change is observed, what evidence is supported, and what explanation has not been ruled out". For example, this example can be said that weak attacks report higher robust accuracy in all three save runs, and the difference is calculated by the same model; it cannot be written as a new defense method that is better than the baseline. If the data is not enough to distinguish the two methods, retaining uncertainty itself is also an effective result, and there is no need to create a winner by truncating the vertical axis or increasing the decimal place.
Formal projects should also record code submissions, data versions, environment lock files, hardware and execution time, and all failures and retries. If a hyperparameter search is performed, the search space, the selected division and additional cost are reported; the final successful operation cannot be recorded only. If there is no reliable record in the time or peak memory, write "UnMeasured", and do not make up the estimates based on the operating scale.
8. Follow-up scientific research issues and summary
Author’s interpretation. In the next step, the test set can be fixed, only the initialization is changed, and then compared with the setting of the new training set, the different random factors are split. Another problem is whether the coverage of the pairing interval is close to the nominal value after increasing the number of real runs; this requires a complete experiment, rather than adjusting the number of bootstraps from 10,000 to one million.
Multitasking research also needs to determine the right to the task or the sample, and make a clear conclusion for the established task set or the new task population. Task selection, normalization, and missing processing are estimated objects that cannot be handed over to the drawing library by default.
Reliable results report starts with the log contract and ends at the boundary of the evidence. A traceable mean, a clearly explained error bar, and a publicly preserved failure record are more scientifically valuable than more decimal places without statistical objects.
References
Search date: 2026-09-22. The following first-hand page and source code have been actually opened; the paper is cited according to the version published in the meeting, and the repository is based on the search date. master Read, dynamic version compatibility is subject to manual verification.
- Rishabh Agarwal, Max Schwarzer, Pablo Samuel Castro, Aaron C. Courville, Marc G. Bellemare. Deep Reinforcement Learning at the Edge of the Statistical Precipice, NeurIPS 2021: Conference page、Paper PDF.
- NeurIPS. Paper Checklist: Statistical Significance and Experimental Reproducibility, online guide, search for the Japanese version.
- Rliable Authors. Official repository and README, supporting open source implementation.
- Rliable Authors. metrics.py, the indicator aggregation is realized.
- Rliable Authors. library.py, layered and independent resampling implementation.
- SciPy Developers. scipy.stats.bootstrap, the page shows v1.18.0; this version is not installed or executed.